
Dockular
•
10K+
vishalvivekanandan05/dockular-extension:0.0.1
Provides resource metrics and automates pruning capabilities
Open in Docker Desktop
This requires Docker Desktop 4.10 or higher.
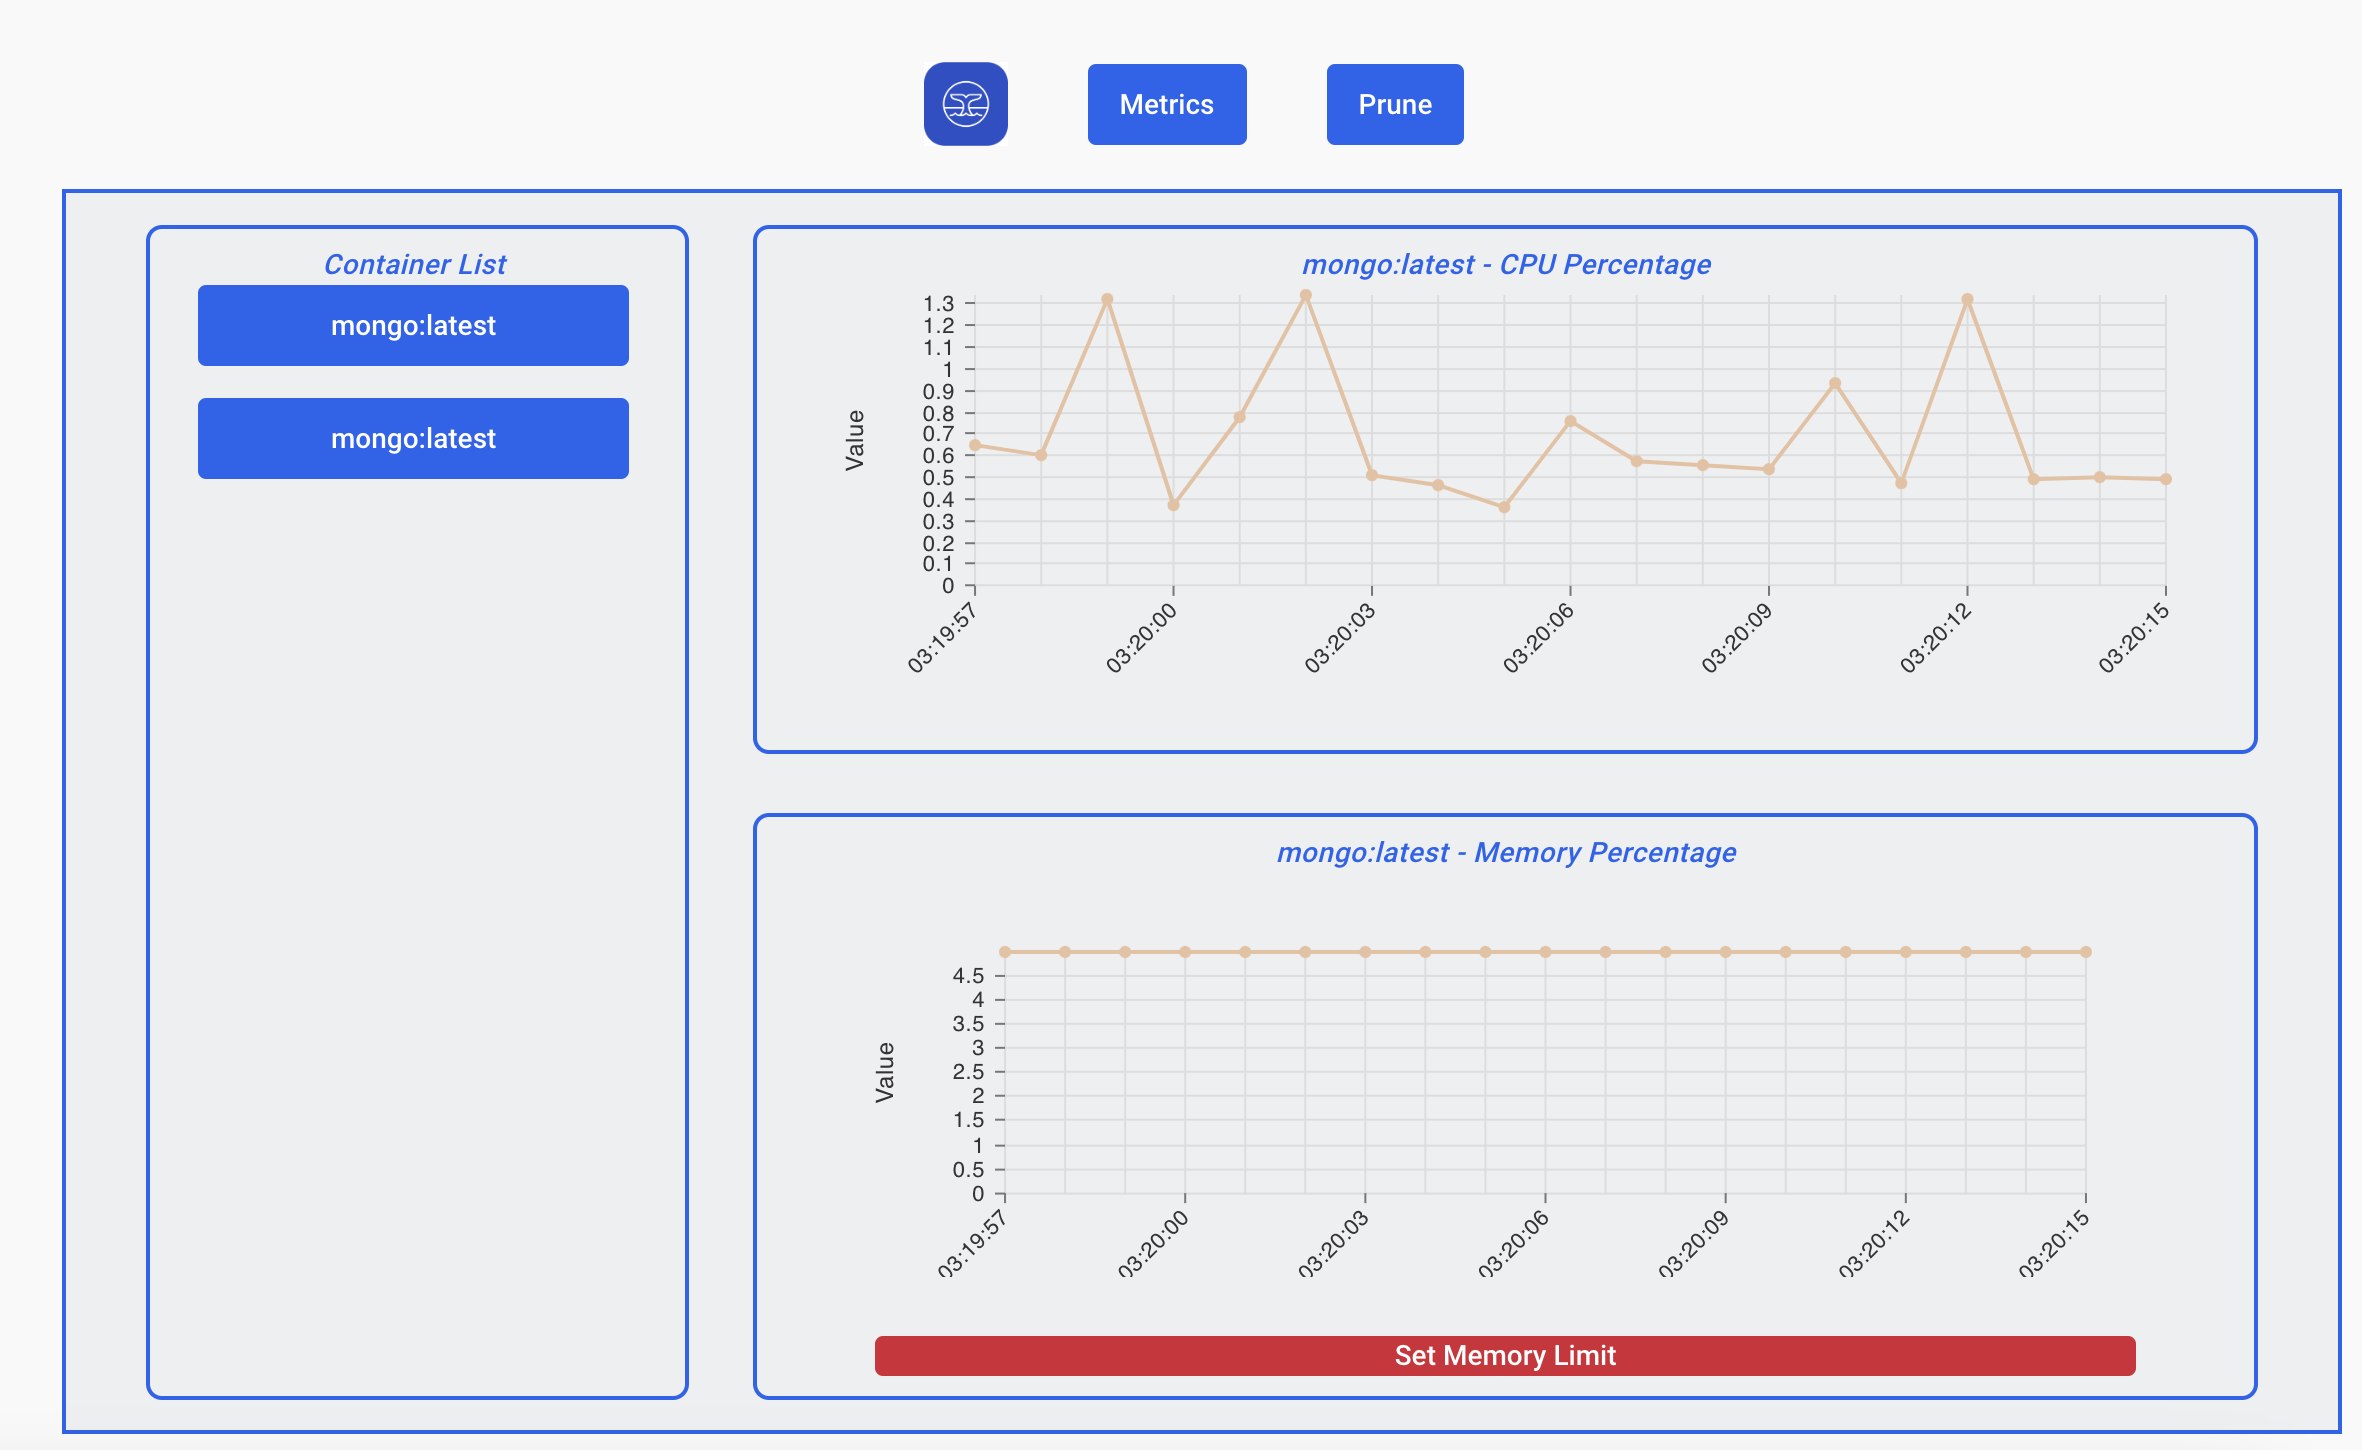
<title>Dashboard Features</title>
Metrics
- The Metrics dashboard provides developers with a visual representation of CPU and Memory usage.
- It grants users the capability to set memory limits on specific containers.
Prune
The Prune dashboard automates complex pruning commands. Some of these features include:
- Prune Selected: which allows users to prune a selected image/container within multiple categories
- Data for each category or image is neatly displayed within a Data Grid which visualizes the amount of memory each image/container uses prior to pruning.
- A progress bar graph that represents the amount of memory which could be reclaimed prior to pruning if the user decides to do a selected prune across multiple different image/container categories.
- The total amount of memory usage per image, container, and build cache category is displayed within each button group.
- Prune All capability: allows users to prune a selection of different images and containers within the same portal.
- Alert messages that provide details on what container(s)/image(s) are unable to be pruned.