compagnonsdudev/kafkaexplorer
Explore Kafka, query it in Flink SQL, audit it with AI — one container, one URL.
6.6K
compagnonsdudev/kafkaexplorer repository overview
⚡ Kafka SQL Explorer
See your Kafka. Query it like a database. Audit it with AI.




Stop squinting at console consumers. Kafka SQL Explorer turns any Kafka cluster into something you can see and query: browse topics, click on a message field, and get a runnable Flink SQL query — no DDL to write, no schema to guess, no CLI gymnastics.
One container, one URL, zero cluster-side installation: it connects as an ordinary Kafka client, so there is nothing to deploy on your brokers.
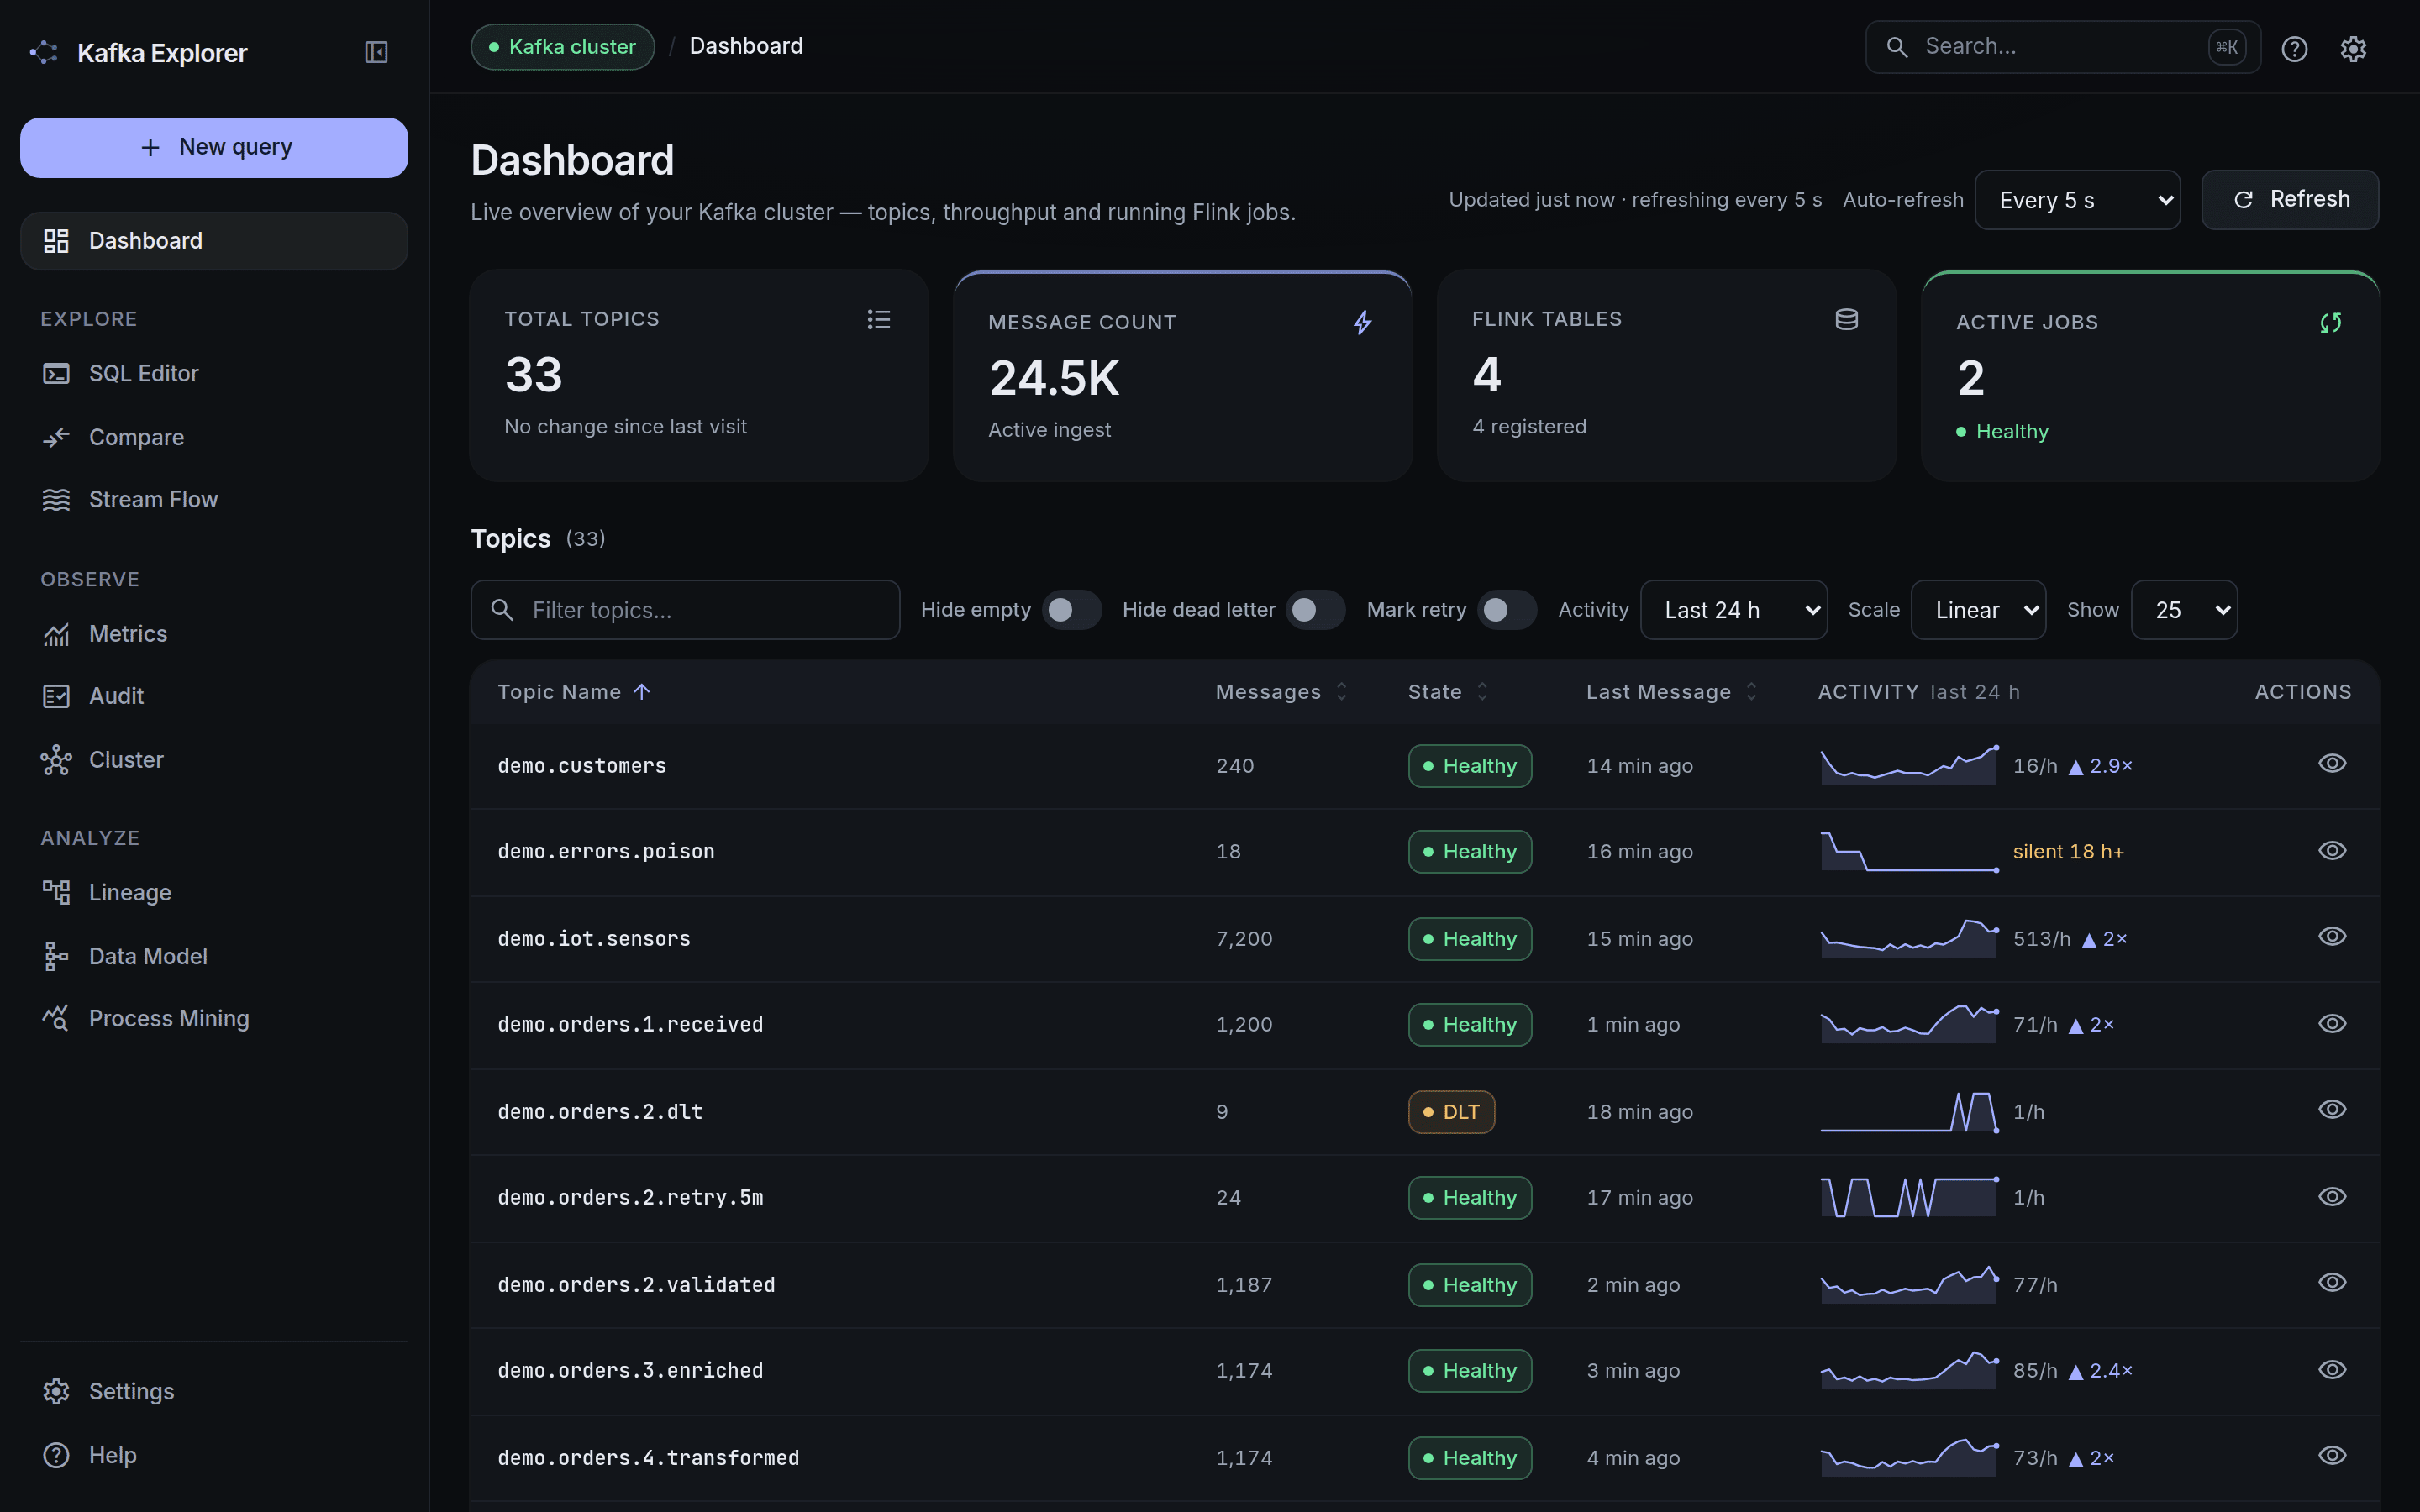
🚀 Try it in one command
Against a broker you already have:
docker run --rm -p 127.0.0.1:8080:8080 \
  -e KAFKA_BOOTSTRAP_SERVERS=your-broker:9092 \
  compagnonsdudev/kafkaexplorer:latest
Open http://localhost:8080.
The port is published on the loopback interface deliberately — this image ships no authentication. See Before you expose it below.
No broker at hand? The snippet below starts Kafka 4.3 (KRaft, no Zookeeper) next to it:
# docker-compose.yml — throwaway sandbox, broker data is not persisted.
services:
  kafka:
    image: apache/kafka:4.3.1
    environment:
      KAFKA_NODE_ID: 1
      KAFKA_PROCESS_ROLES: broker,controller
      KAFKA_CONTROLLER_QUORUM_VOTERS: 1@kafka:9093
      KAFKA_LISTENERS: PLAINTEXT://:29092,CONTROLLER://:9093,PLAINTEXT_HOST://:9092
      KAFKA_ADVERTISED_LISTENERS: PLAINTEXT://kafka:29092,PLAINTEXT_HOST://localhost:9092
      KAFKA_LISTENER_SECURITY_PROTOCOL_MAP: CONTROLLER:PLAINTEXT,PLAINTEXT:PLAINTEXT,PLAINTEXT_HOST:PLAINTEXT
      KAFKA_CONTROLLER_LISTENER_NAMES: CONTROLLER
      KAFKA_INTER_BROKER_LISTENER_NAME: PLAINTEXT
      KAFKA_OFFSETS_TOPIC_REPLICATION_FACTOR: 1
      KAFKA_TRANSACTION_STATE_LOG_REPLICATION_FACTOR: 1
      KAFKA_TRANSACTION_STATE_LOG_MIN_ISR: 1
      KAFKA_SHARE_COORDINATOR_STATE_TOPIC_REPLICATION_FACTOR: 1
      KAFKA_SHARE_COORDINATOR_STATE_TOPIC_MIN_ISR: 1
      CLUSTER_ID: MkU2OhlMTT69sPFvS1n16g

  explorer:
    image: compagnonsdudev/kafkaexplorer:latest
    # No authentication in the box — see "Before you expose it" below.
    ports:
      - "127.0.0.1:8080:8080"
    # Not optional. The JVM runs with -XX:MaxRAMPercentage=75, which without a limit
    # reads the *host's* memory: on a 32 GB machine it believes it may take 24.
    mem_limit: 2g
    environment:
      KAFKA_BOOTSTRAP_SERVERS: kafka:29092
      KAFKA_CONSUMER_GROUP_PROTOCOL: consumer   # KIP-848, Kafka 4.x brokers only
    volumes:
      - explorer_logs:/app/logs
      - explorer_data:/app/data
    # Graceful web shutdown (15s) + bean destruction (10s) + JVM exit. Docker's default
    # of 10s SIGKILLs exactly what those budgets exist to protect.
    stop_grace_period: 35s
    depends_on: [kafka]

volumes:
  explorer_logs:
  explorer_data:
The repository's own stacks go
further: docker compose up -d there also seeds 76 demo topics — a 6-step order
pipeline to trace across partitions, header-only correlations, a real time series to
window, plus duplicates and poison records for the audit to find.
With a private AI beside it, from published images
Process Mining can be answered by SpectraLLM
— a local RAG stack published under this same namespace — so the flowcharts and the anomaly
hunt run on your machine, with no API key and nothing leaving your network.
compose/spectra-hub.yml
wires the pair from published images only — no Maven, no npm, no SpectraLLM checkout, and
nothing built. It does need this repository, for the demo seeder and the three entrypoints it
mounts:
git clone --depth 1 https://github.com/devdownin/Kafkaexplorer.git
cd Kafkaexplorer
docker compose -f compose/spectra-hub.yml pull
docker compose -f compose/spectra-hub.yml up -d
Kafka Explorer on http://localhost:8080, the SpectraLLM UI on http://localhost:8088.
The first boot downloads ~4.8 GB of model weights in the background — nothing waits for it,
so both interfaces are up in seconds and Process Mining starts answering once the weights
land. Plan for ~16 GB of RAM; a GPU turns minutes per analysis into seconds, through the
.gpu.yml overlay
next to it.
One overlay goes further than sharing a model:
.ingest.yml
has SpectraLLM index the topics themselves, so the corpus answers questions about what is
in your messages, with cited sources — and the Explorer's own audits can read it. Every
variable is documented in
.env.example,
and the compose file explains each choice it makes.
✨ What you get
- 🖱️ Click-to-query — click a JSON key or XML tag in a message preview and it lands in your
SELECT/WHERE, withJSON_VALUE/XPath generated for you. - 🧠 Zero-config schemas — topics are sampled, their structure inferred (JSON, XML, Avro via Schema Registry), and registered as Flink tables in one click.
- 📝 A real SQL editor — Monaco (the VS Code engine), auto-completion scoped to the tables your query actually cites, query history, earliest/latest read modes, windowing assistant.
- 🔎 Search that says what it scanned — text, regex, field path, JSONPath, XPath, record key or Kafka header, over the whole topic, with hits, records scanned, why the pass stopped, and a cursor to continue. A search here is never silently partial.
- 🕸️ Lineage & tracing — an interactive graph of topics → tables → live jobs, resolved by Flink's own parser; plus cross-topic message tracing by key, header, JSONPath or XPath, streaming its hops as it finds them and comparing two keys side by side.
- 🗺️ A data model you did not have to draw — read a set of topics as tables, with the relations between them deduced from key-column names. Kafka has no foreign keys, so every edge is graded, states its evidence, and opens as a ready
JOIN— one relation or a whole subgraph. - 🩺 One-click cluster audit — poison messages, duplicates, flow drop-offs and latency, graded by severity, computed across your whole cluster in the background and diffable against the previous run.
- 📉 Consumer lag that grades itself — who reads a topic and how far behind, with
stalled(nothing assigned),partial(never committed on some partitions) andaheadcalled out rather than folded into one number. - ⏱️ Backlog in time, not just in records — the same 4 000 messages are four seconds of traffic on one topic and four days on another. Ask any group how long its oldest unread message has been waiting, from the topic page or as a scheduled metric; a partition that could not be read says so instead of reporting zero.
- 💡 KPIs proposed from what your cluster was observed doing — the Metrics page derives them from your audit, your traces, your running Flink jobs and your Process Mining mapping. Every card names the measurement it rests on and where its thresholds come from; nothing is created until you preview and save it.
- 🔮 TimesFM forecasting, safely staged — the optional CPU service prepares bounded metric contexts and runs forecasts in
SHADOWby default. Five read-only MCP tools expose existing forecast snapshots and provenance; no MCP call starts inference, and thresholds remain explicit operator policy rather than model guesses. - 🤖 AI process mining — reconstruct business flows as flowcharts and hunt anomalies with OpenRouter (the default: one key, most hosted vendors), Claude, any local LLM (Ollama, vLLM, LM Studio…), or a fully private SpectraLLM. Point it at a local provider and nothing leaves your network; the default is hosted, and both pages that call a model say which of the two you are on — read off the address, not the provider's name.
- 💰 What the AI cost, and a cap if you want one — every analysis shows the tokens and the price the provider reported, per call and per run, never an estimate; nothing is shown where a provider prices nothing, rather than a misleading zero.
CLAUDE_SESSION_COST_LIMIT_USDstops a live session once it has spent that much, which is what bounds a tab left open overnight. - 🔭 Kafka 4 native — KRaft controller quorum, KIP-848 consumer groups, share groups (KIP-932) and feature versions, in the UI and on
/actuator/prometheus. - 🔌 An MCP server for your agent — the same analysis layer over the Model Context Protocol: SQL over vanilla Kafka, schema inference, key tracing, graded consumer lag, environment-specific topic policy checks, and DLQ route reviews. Every answer carries a
coverageenvelope naming what it did not read. The image enables MCP by default but requires a configured bearer token to serve requests; tools are read-only by default, scoped by topic prefix — the SQL included — rate-limited and redacted. The app's MCP page shows what it exposed, what it withheld and what every agent did with it.
Full feature tour: docs/FEATURES.md
Browse naming conventions from Explore → Topic hierarchy: select ., - or _, inspect excluded names and navigate large trees with the keyboard. The tree groups names only; it does not assert a Kafka data flow. Topic hierarchy guide.
🖼️ A look around
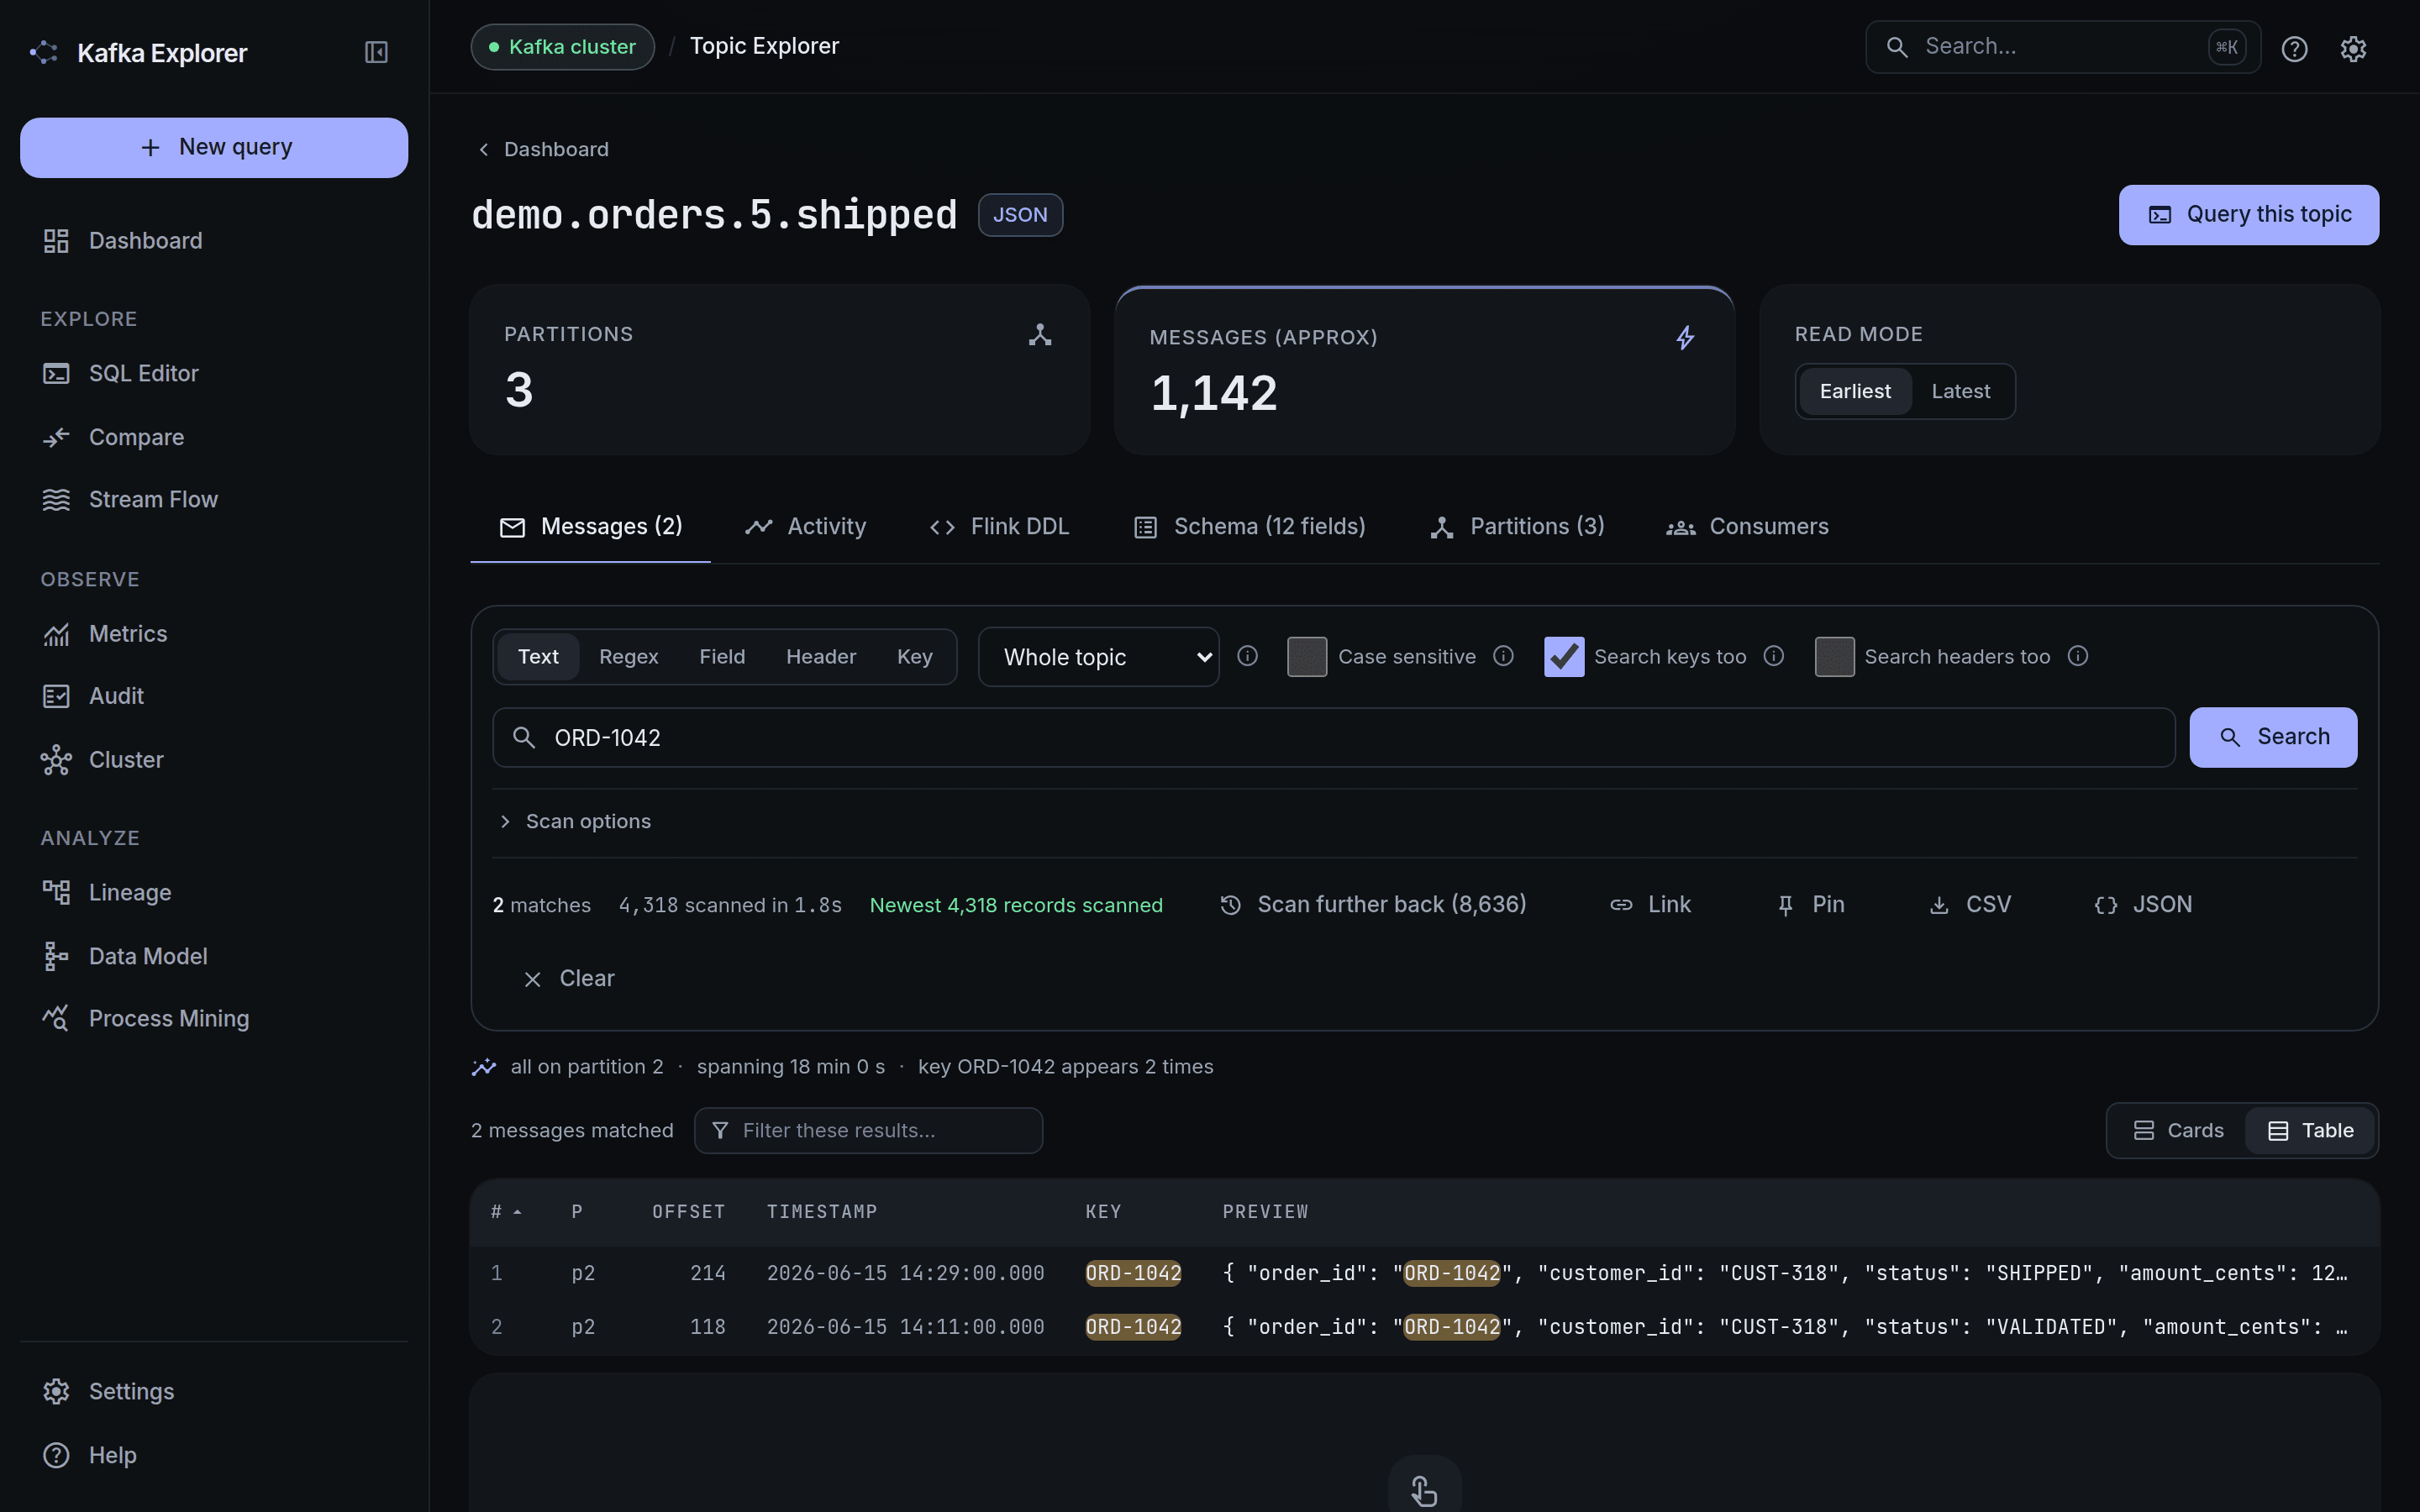
Topic Explorer — search the whole topic (text, regex, field path, JSONPath, XPath, record key or Kafka header), see the matches highlighted, and read exactly what was covered: how many records were scanned, why the pass stopped, and whether it can be continued.
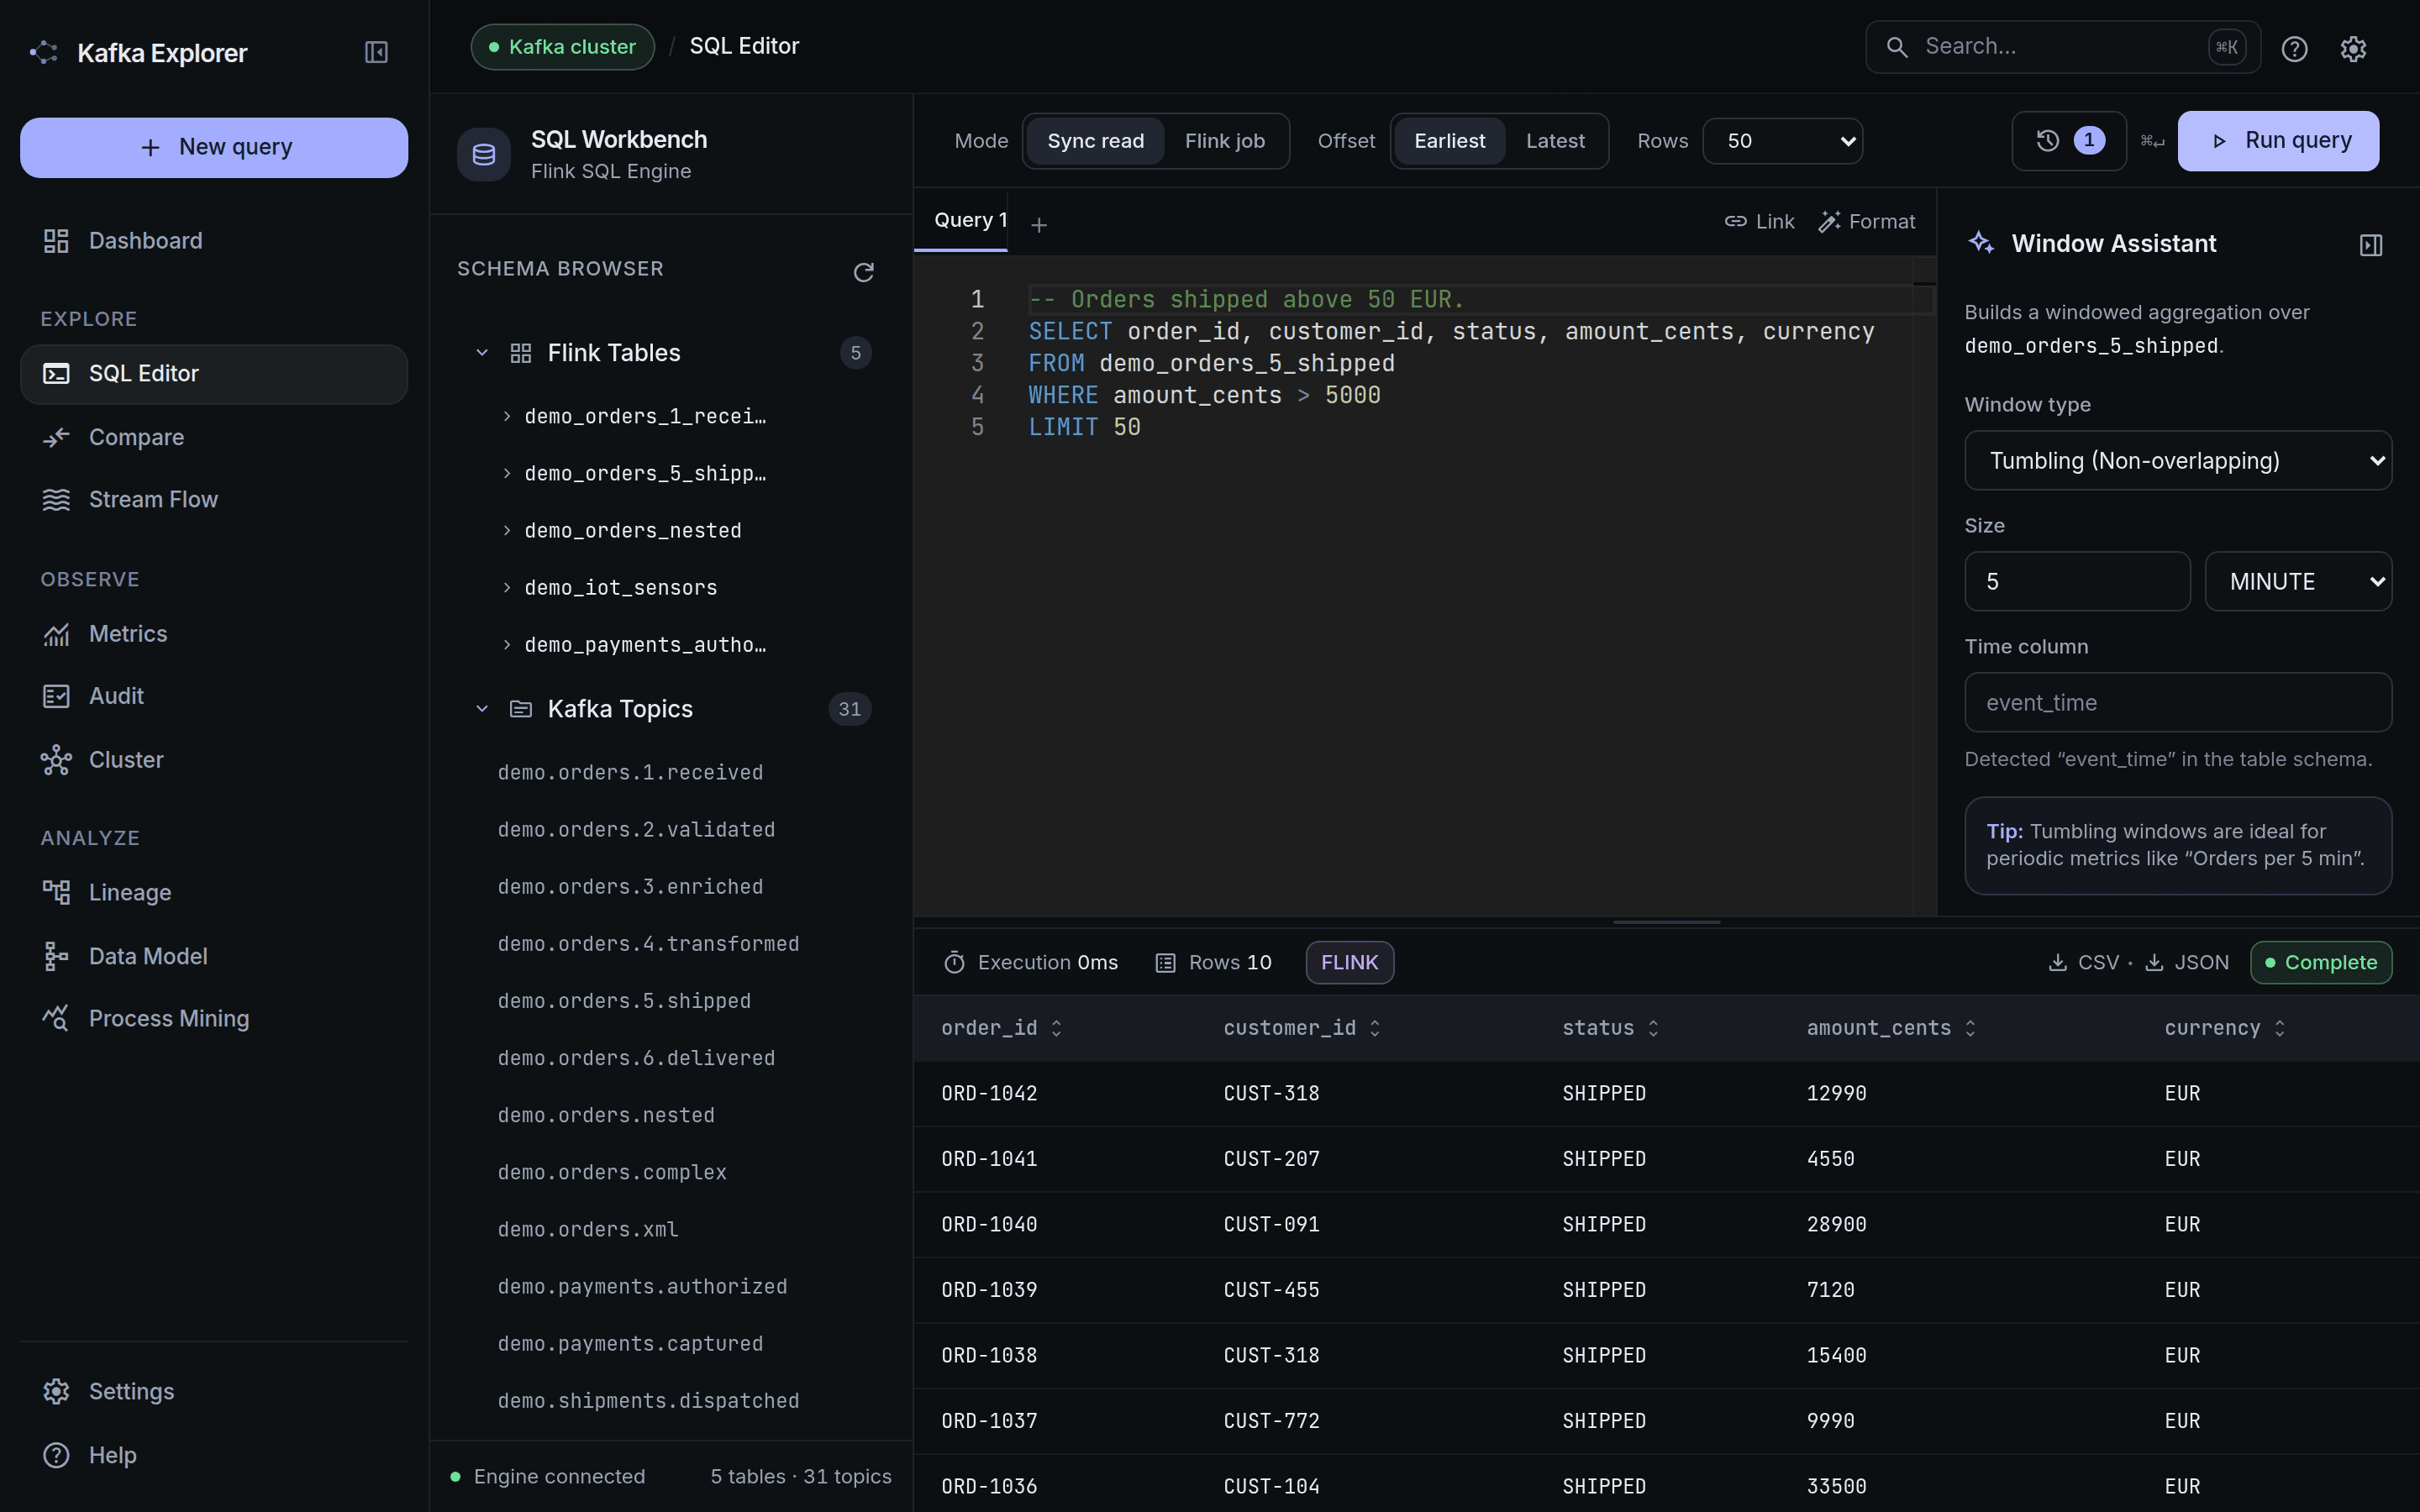
SQL Editor — Monaco, with the topics and Flink tables in the sidebar, completion scoped to
the tables the query actually cites, and the engine that answered stated on the result
(FLINK here, KAFKA_DIRECT when the planner falls back).
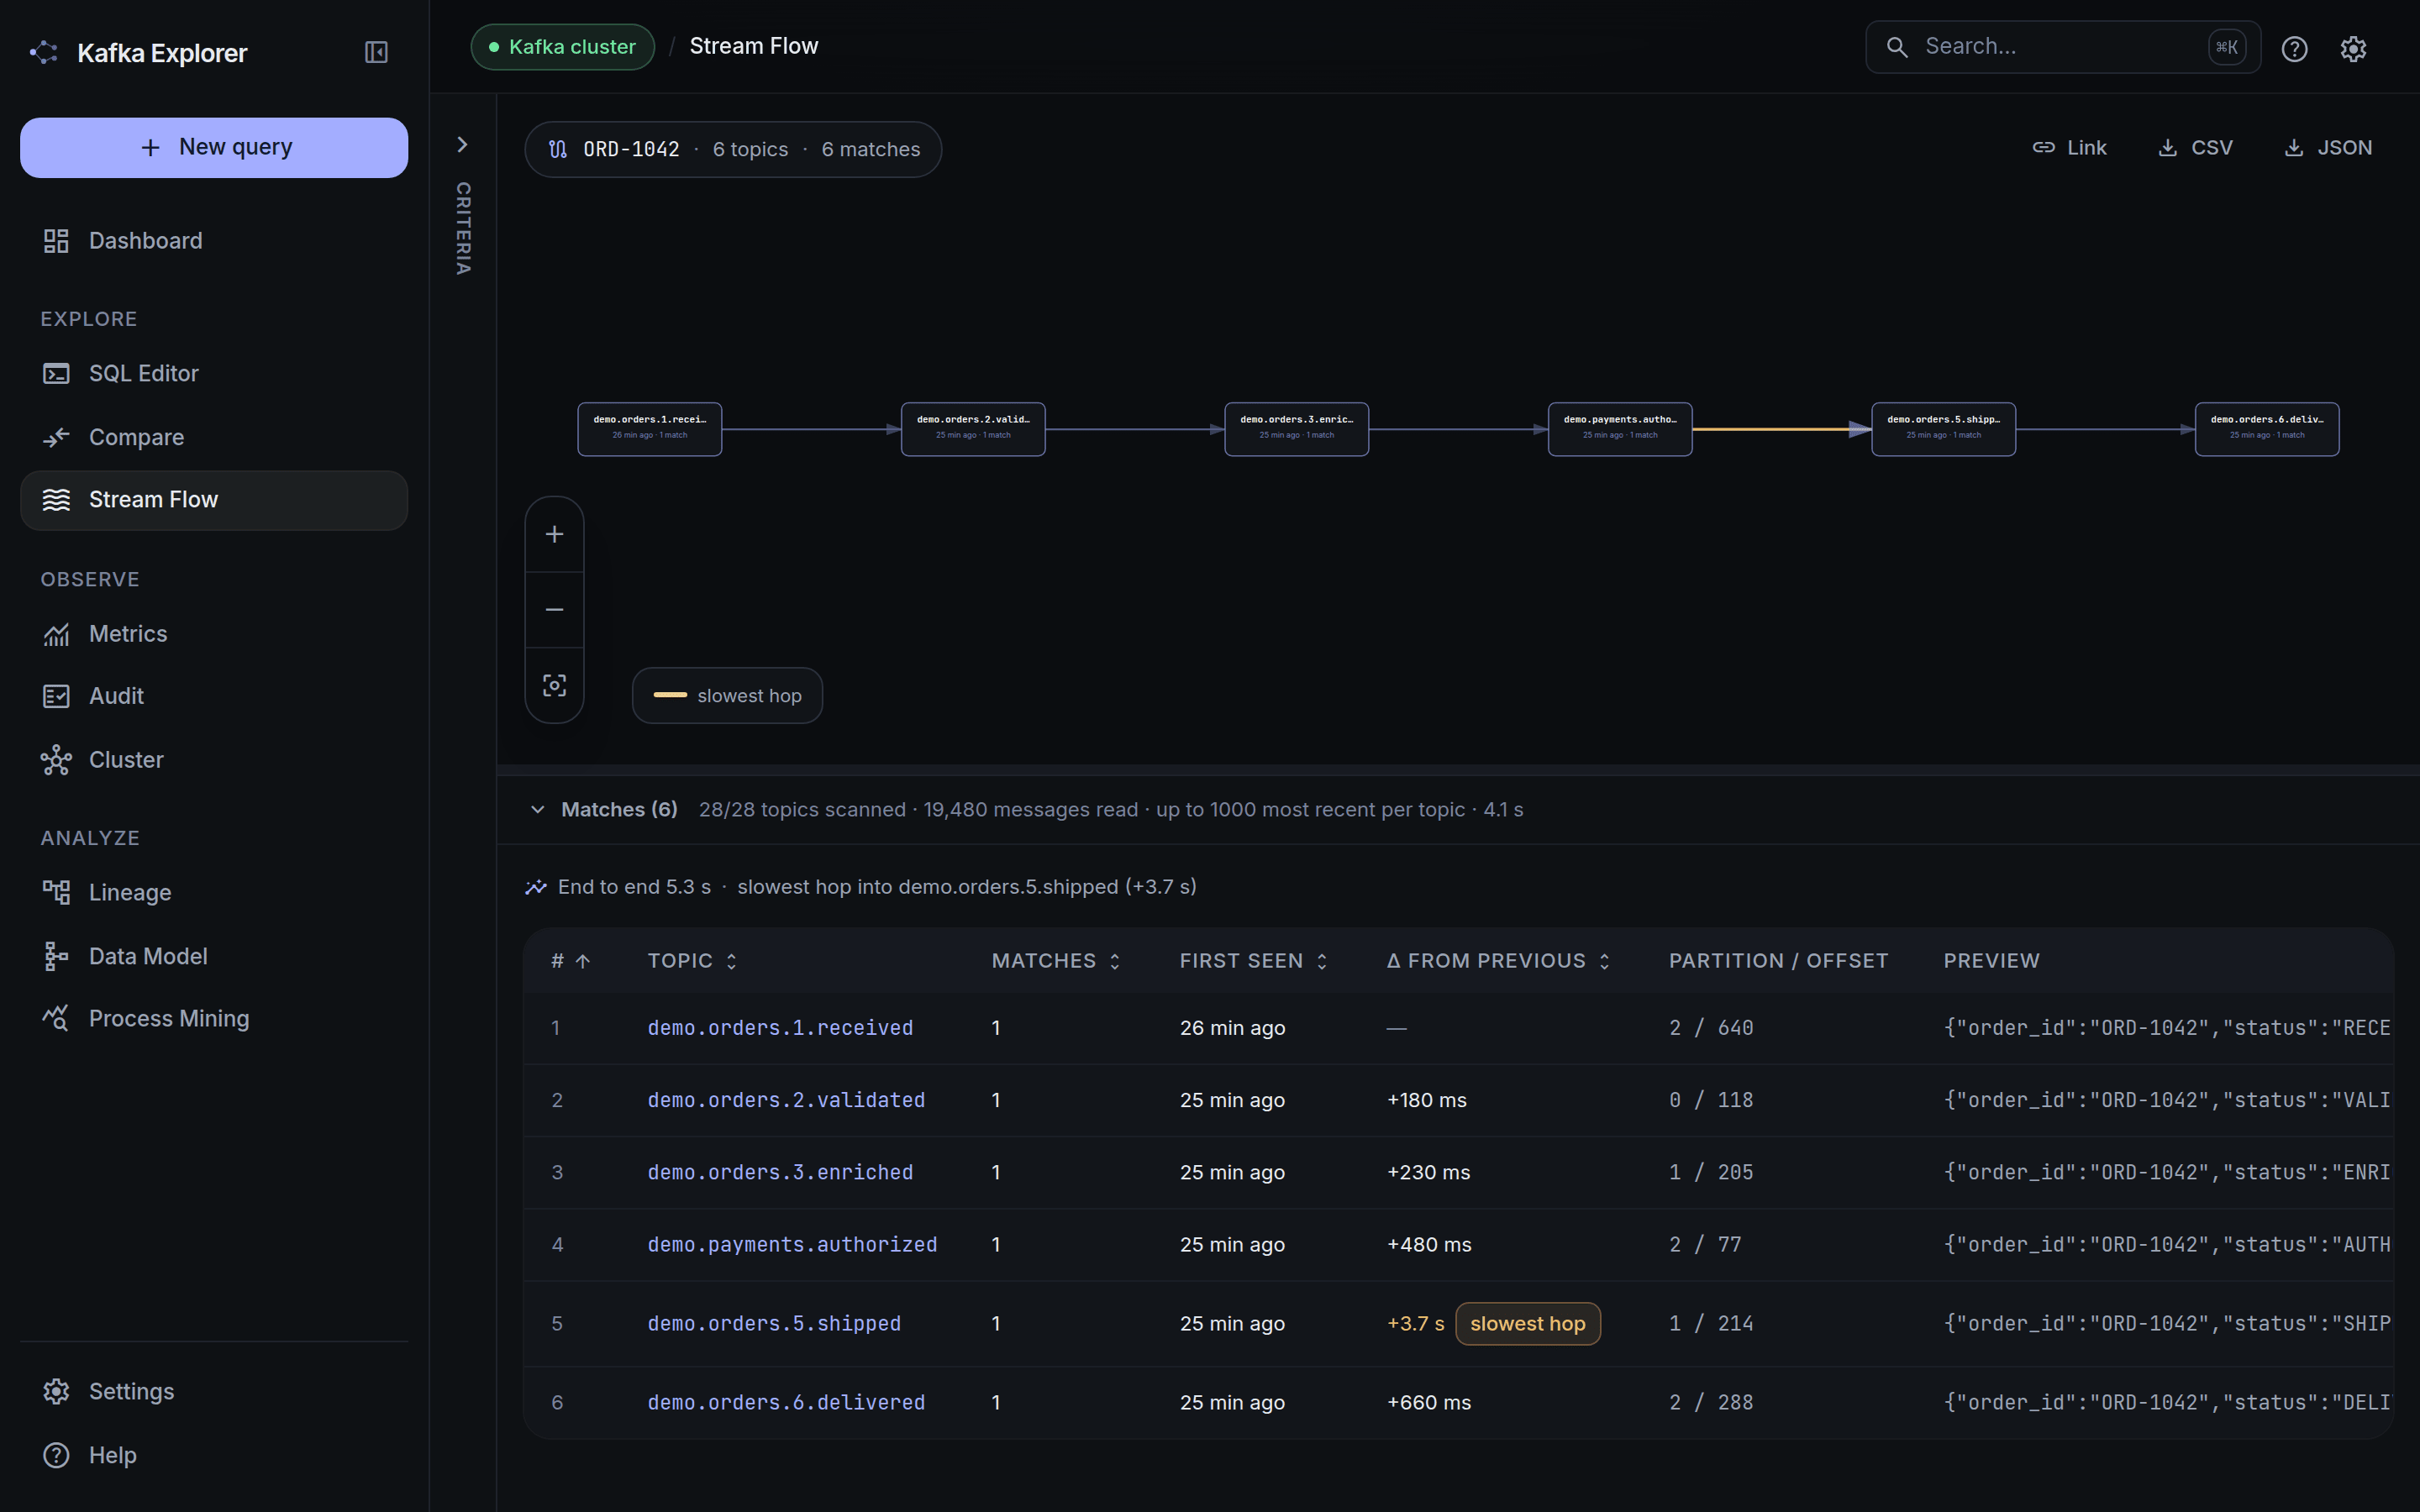
Stream Flow — follow one record key across the cluster. The chain is drawn from first sightings, each hop carries its latency from the previous one, the slowest is called out, and the evidence table underneath gives partition, offset and payload for every hop, so the graph can be checked rather than believed.
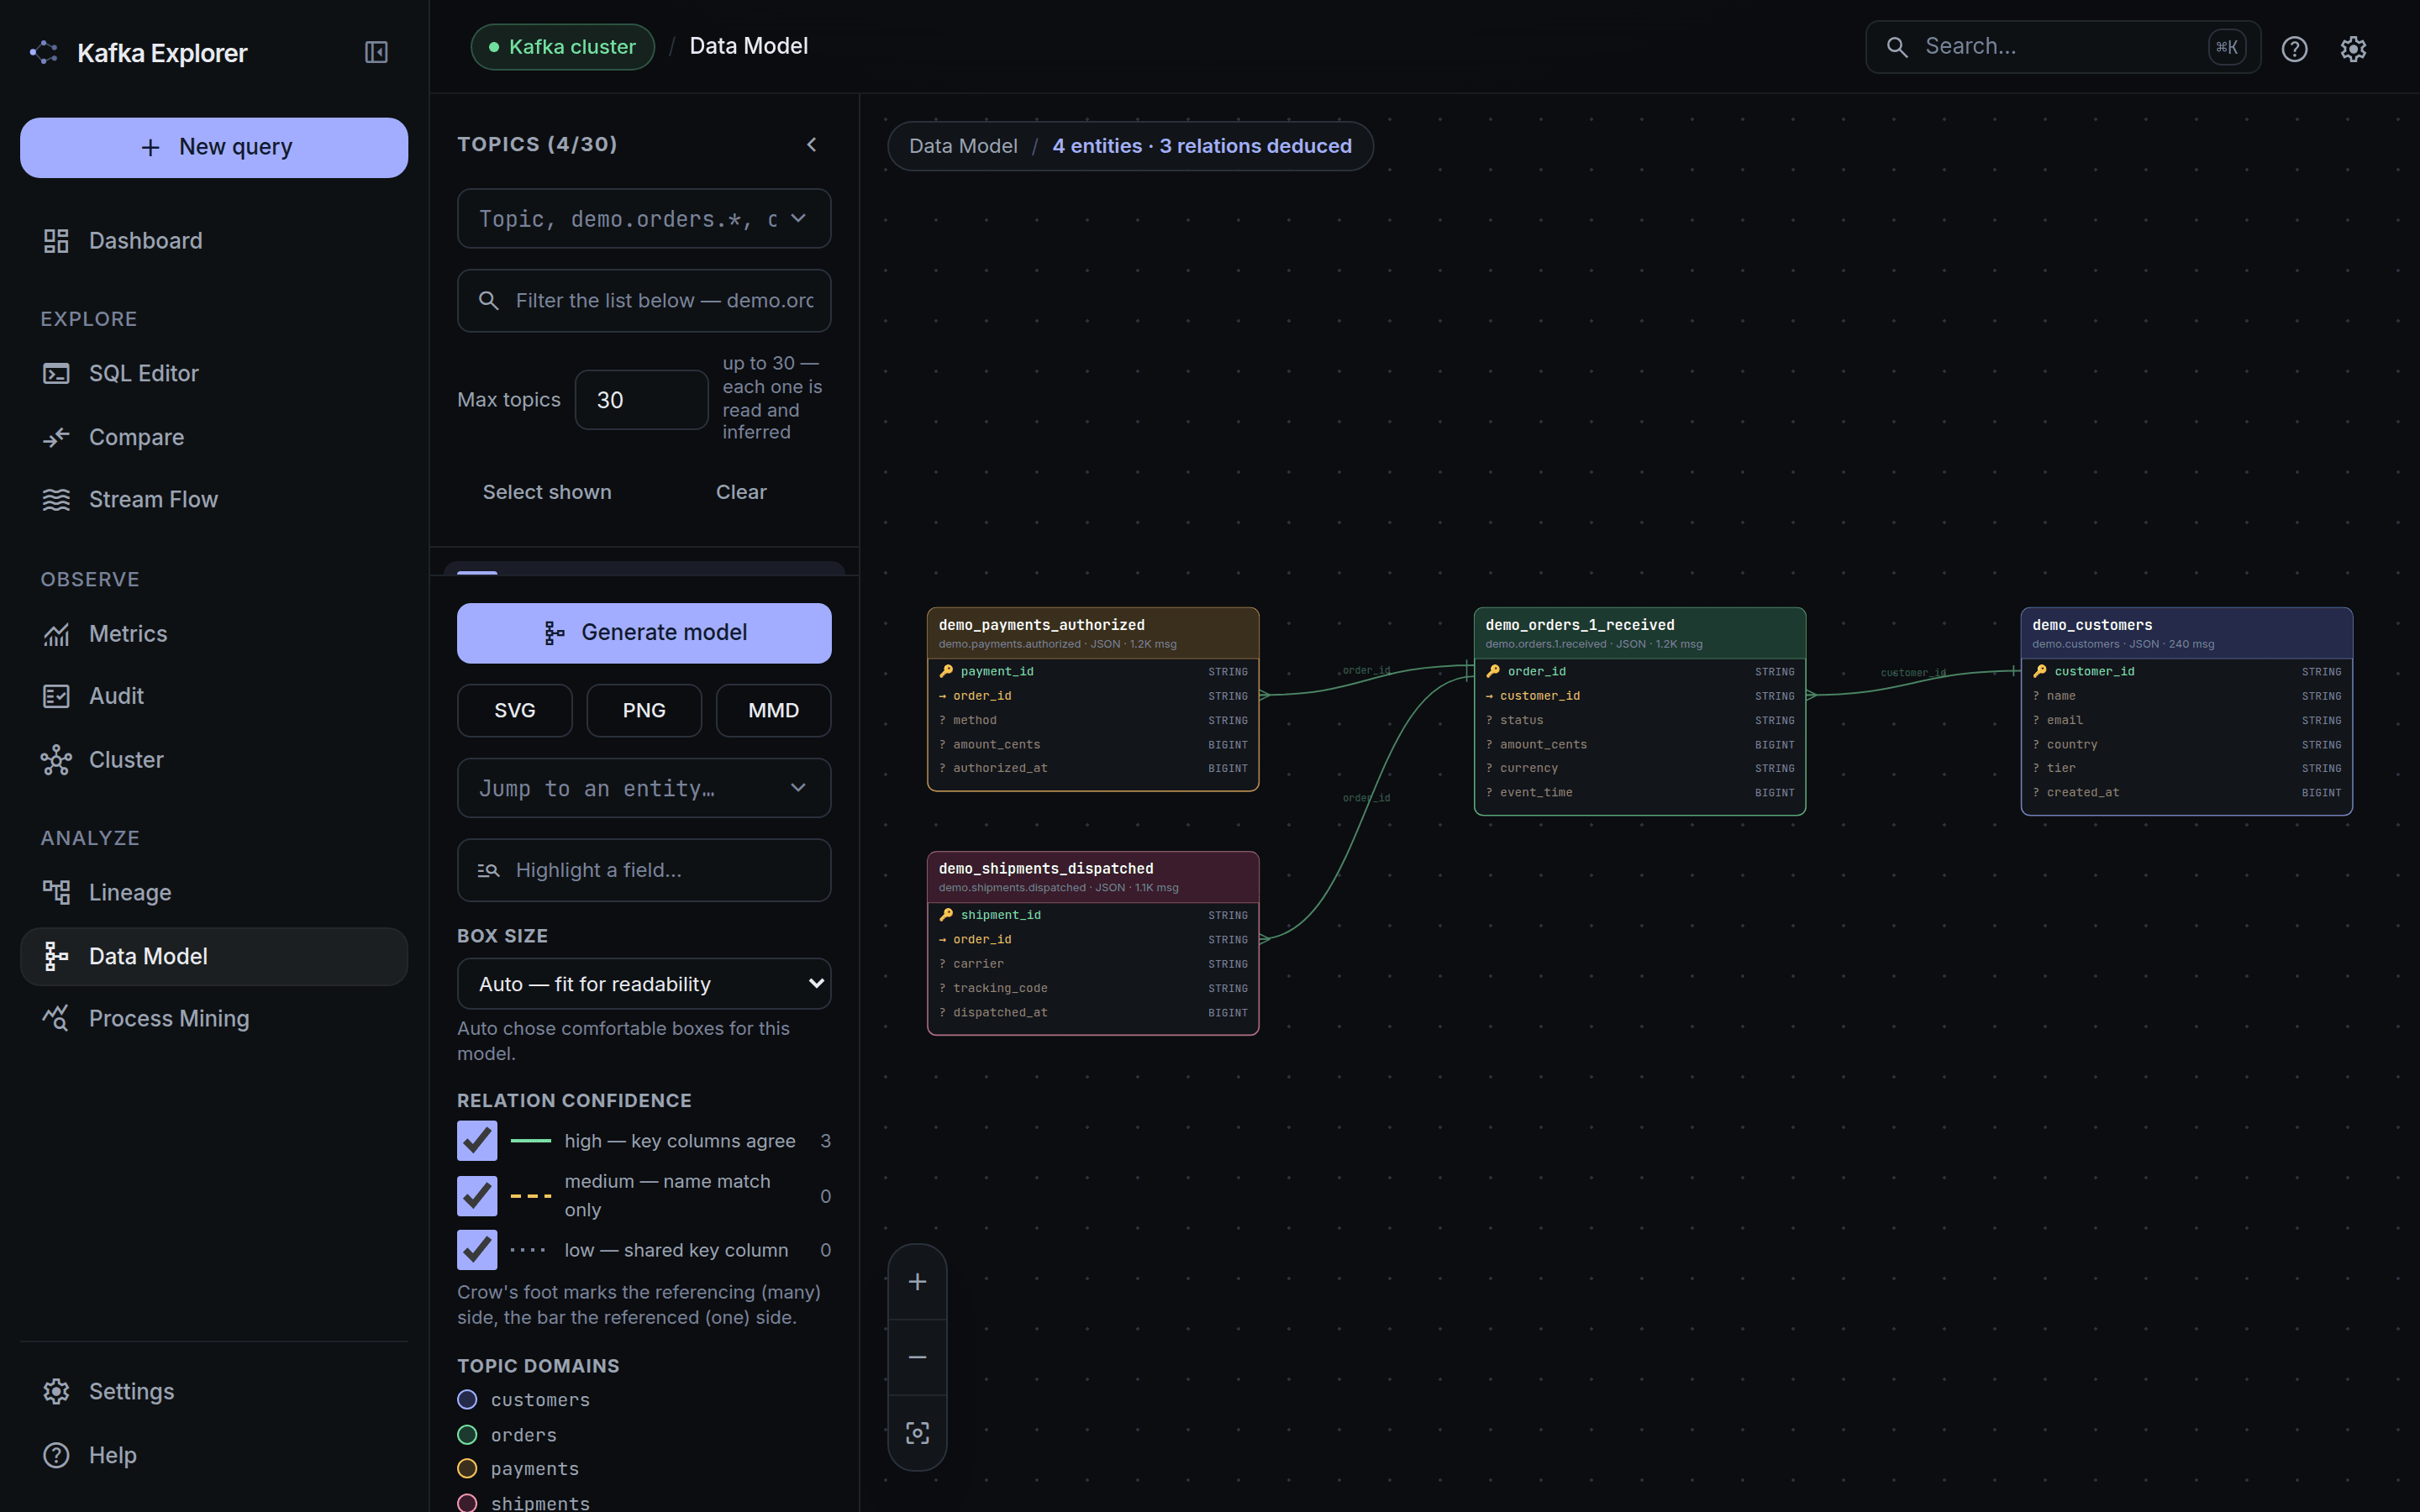
Data Model — pick a set of topics and read them as tables: each becomes a card carrying its
inferred columns, and the relations between them are deduced from key-column names. Kafka has no
foreign keys, so every edge is a claim rather than a fact — it is graded, drawn in a line style
that says which grade it is, and states in plain words the evidence it rests on. The key column is
detected, never invented: an entity with no id-like field simply has no key. A relation, or a whole
subgraph, opens as a ready JOIN in the SQL editor — and is refused rather than given an invented
predicate when the deduced relations do not connect it. Exports as SVG, PNG or a Mermaid
erDiagram, each carrying the coverage line and what is not drawn.
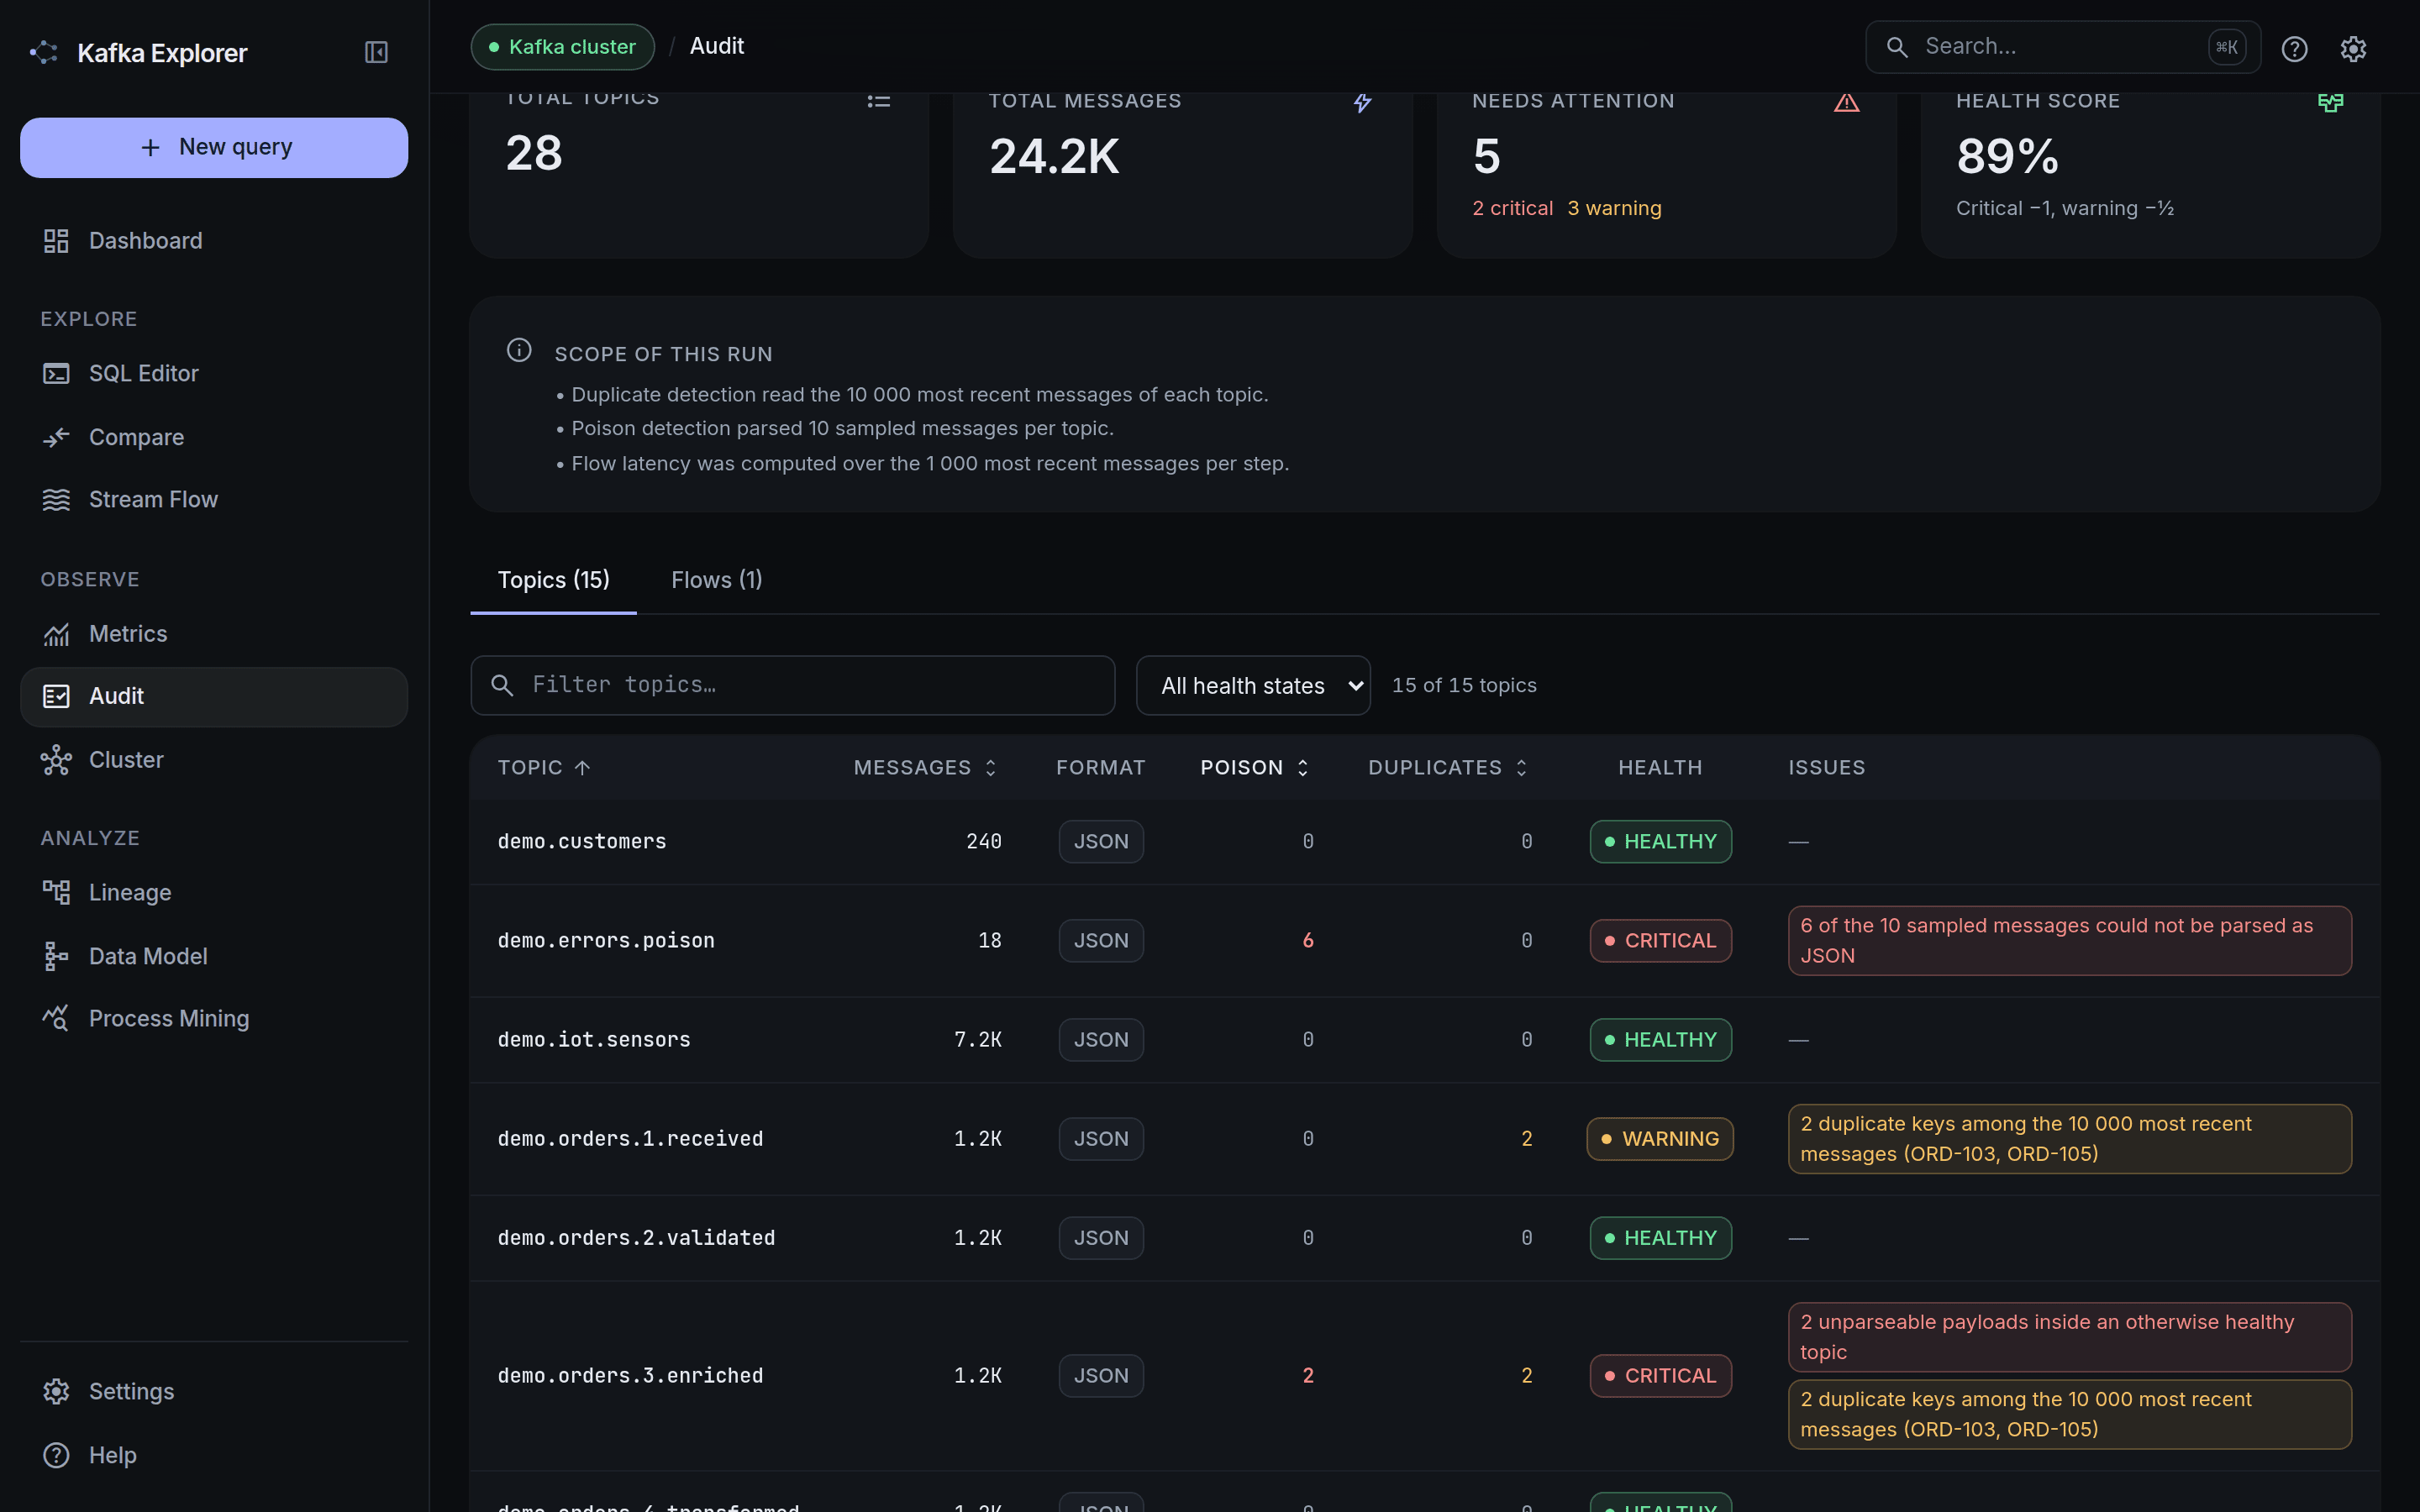
Cluster Audit — one click, whole cluster: message formats, poison payloads, duplicate
keys, flow drop-off and latency, graded HEALTHY / WARNING / CRITICAL. Every run states
its own scope, because a check that quietly sampled ten messages must not read like a verdict
on a million.
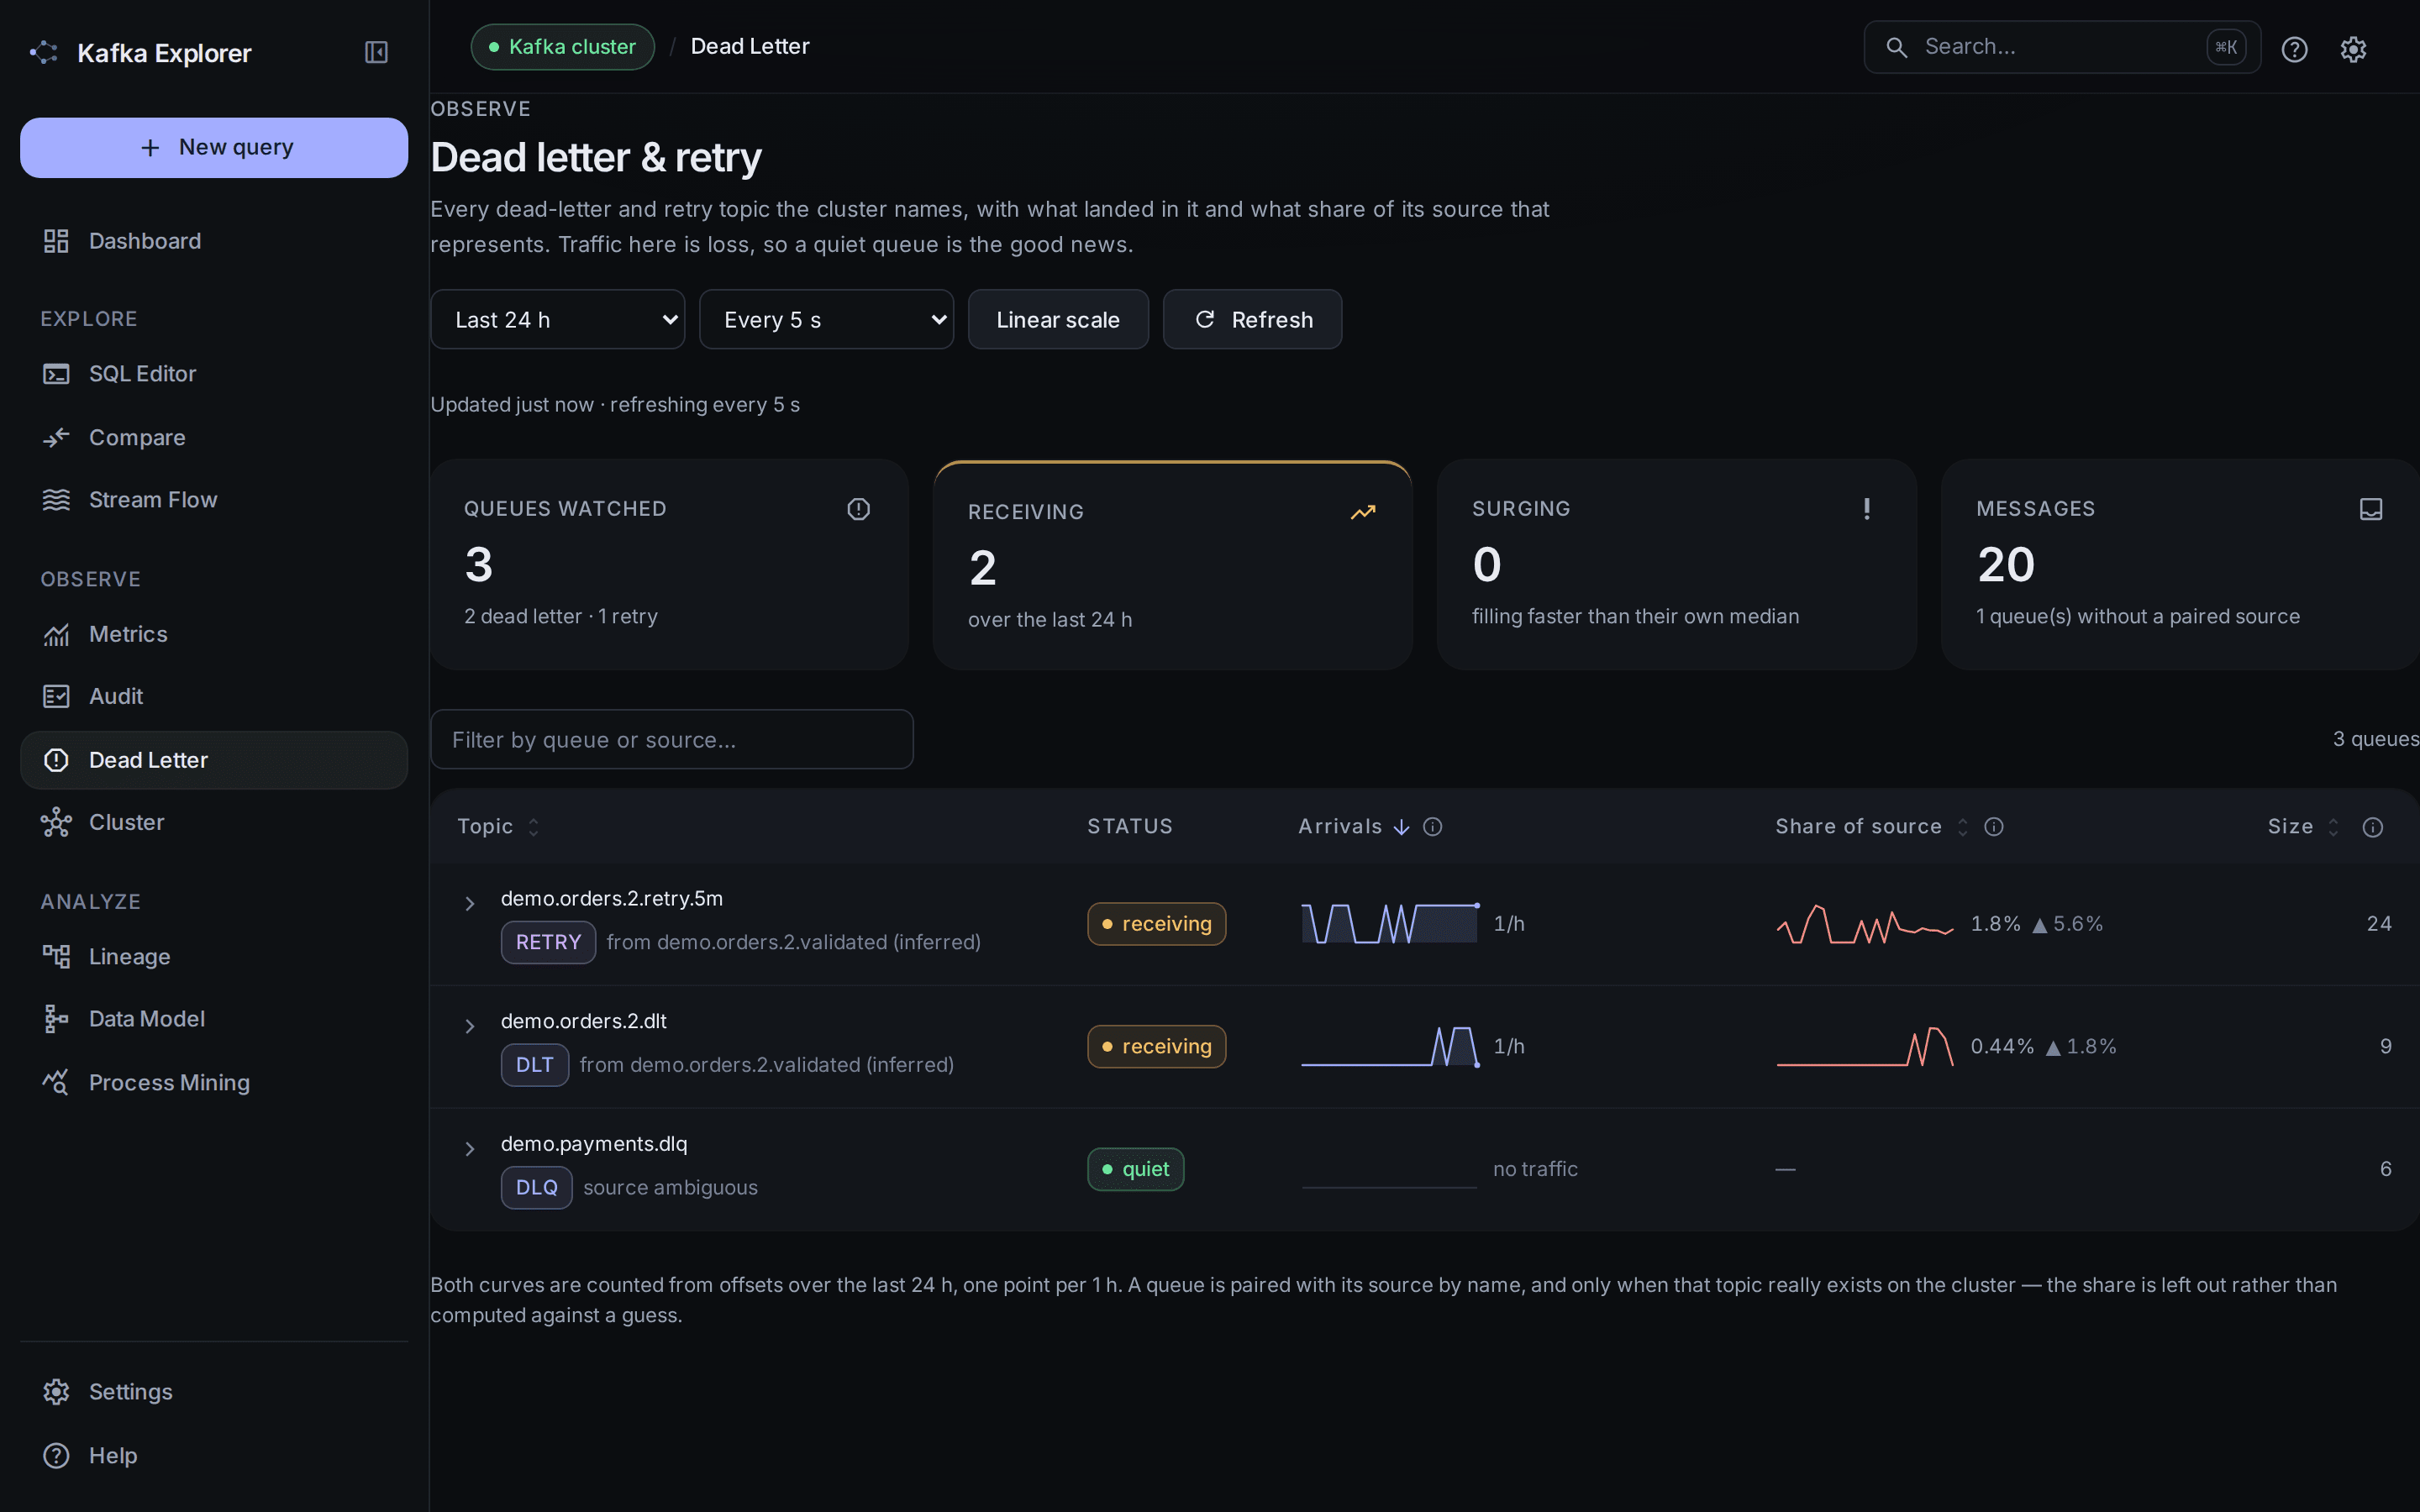
Dead Letter & Retry — every topic named .DLQ, .DLT or retry, with two curves each:
what landed in it, and what share of its source topic that represents. A count of failures
compares to nothing on its own; a rate compares between topics and between weeks. Where the
source cannot be identified without guessing, the page says so instead of computing a rate
against part of the traffic.
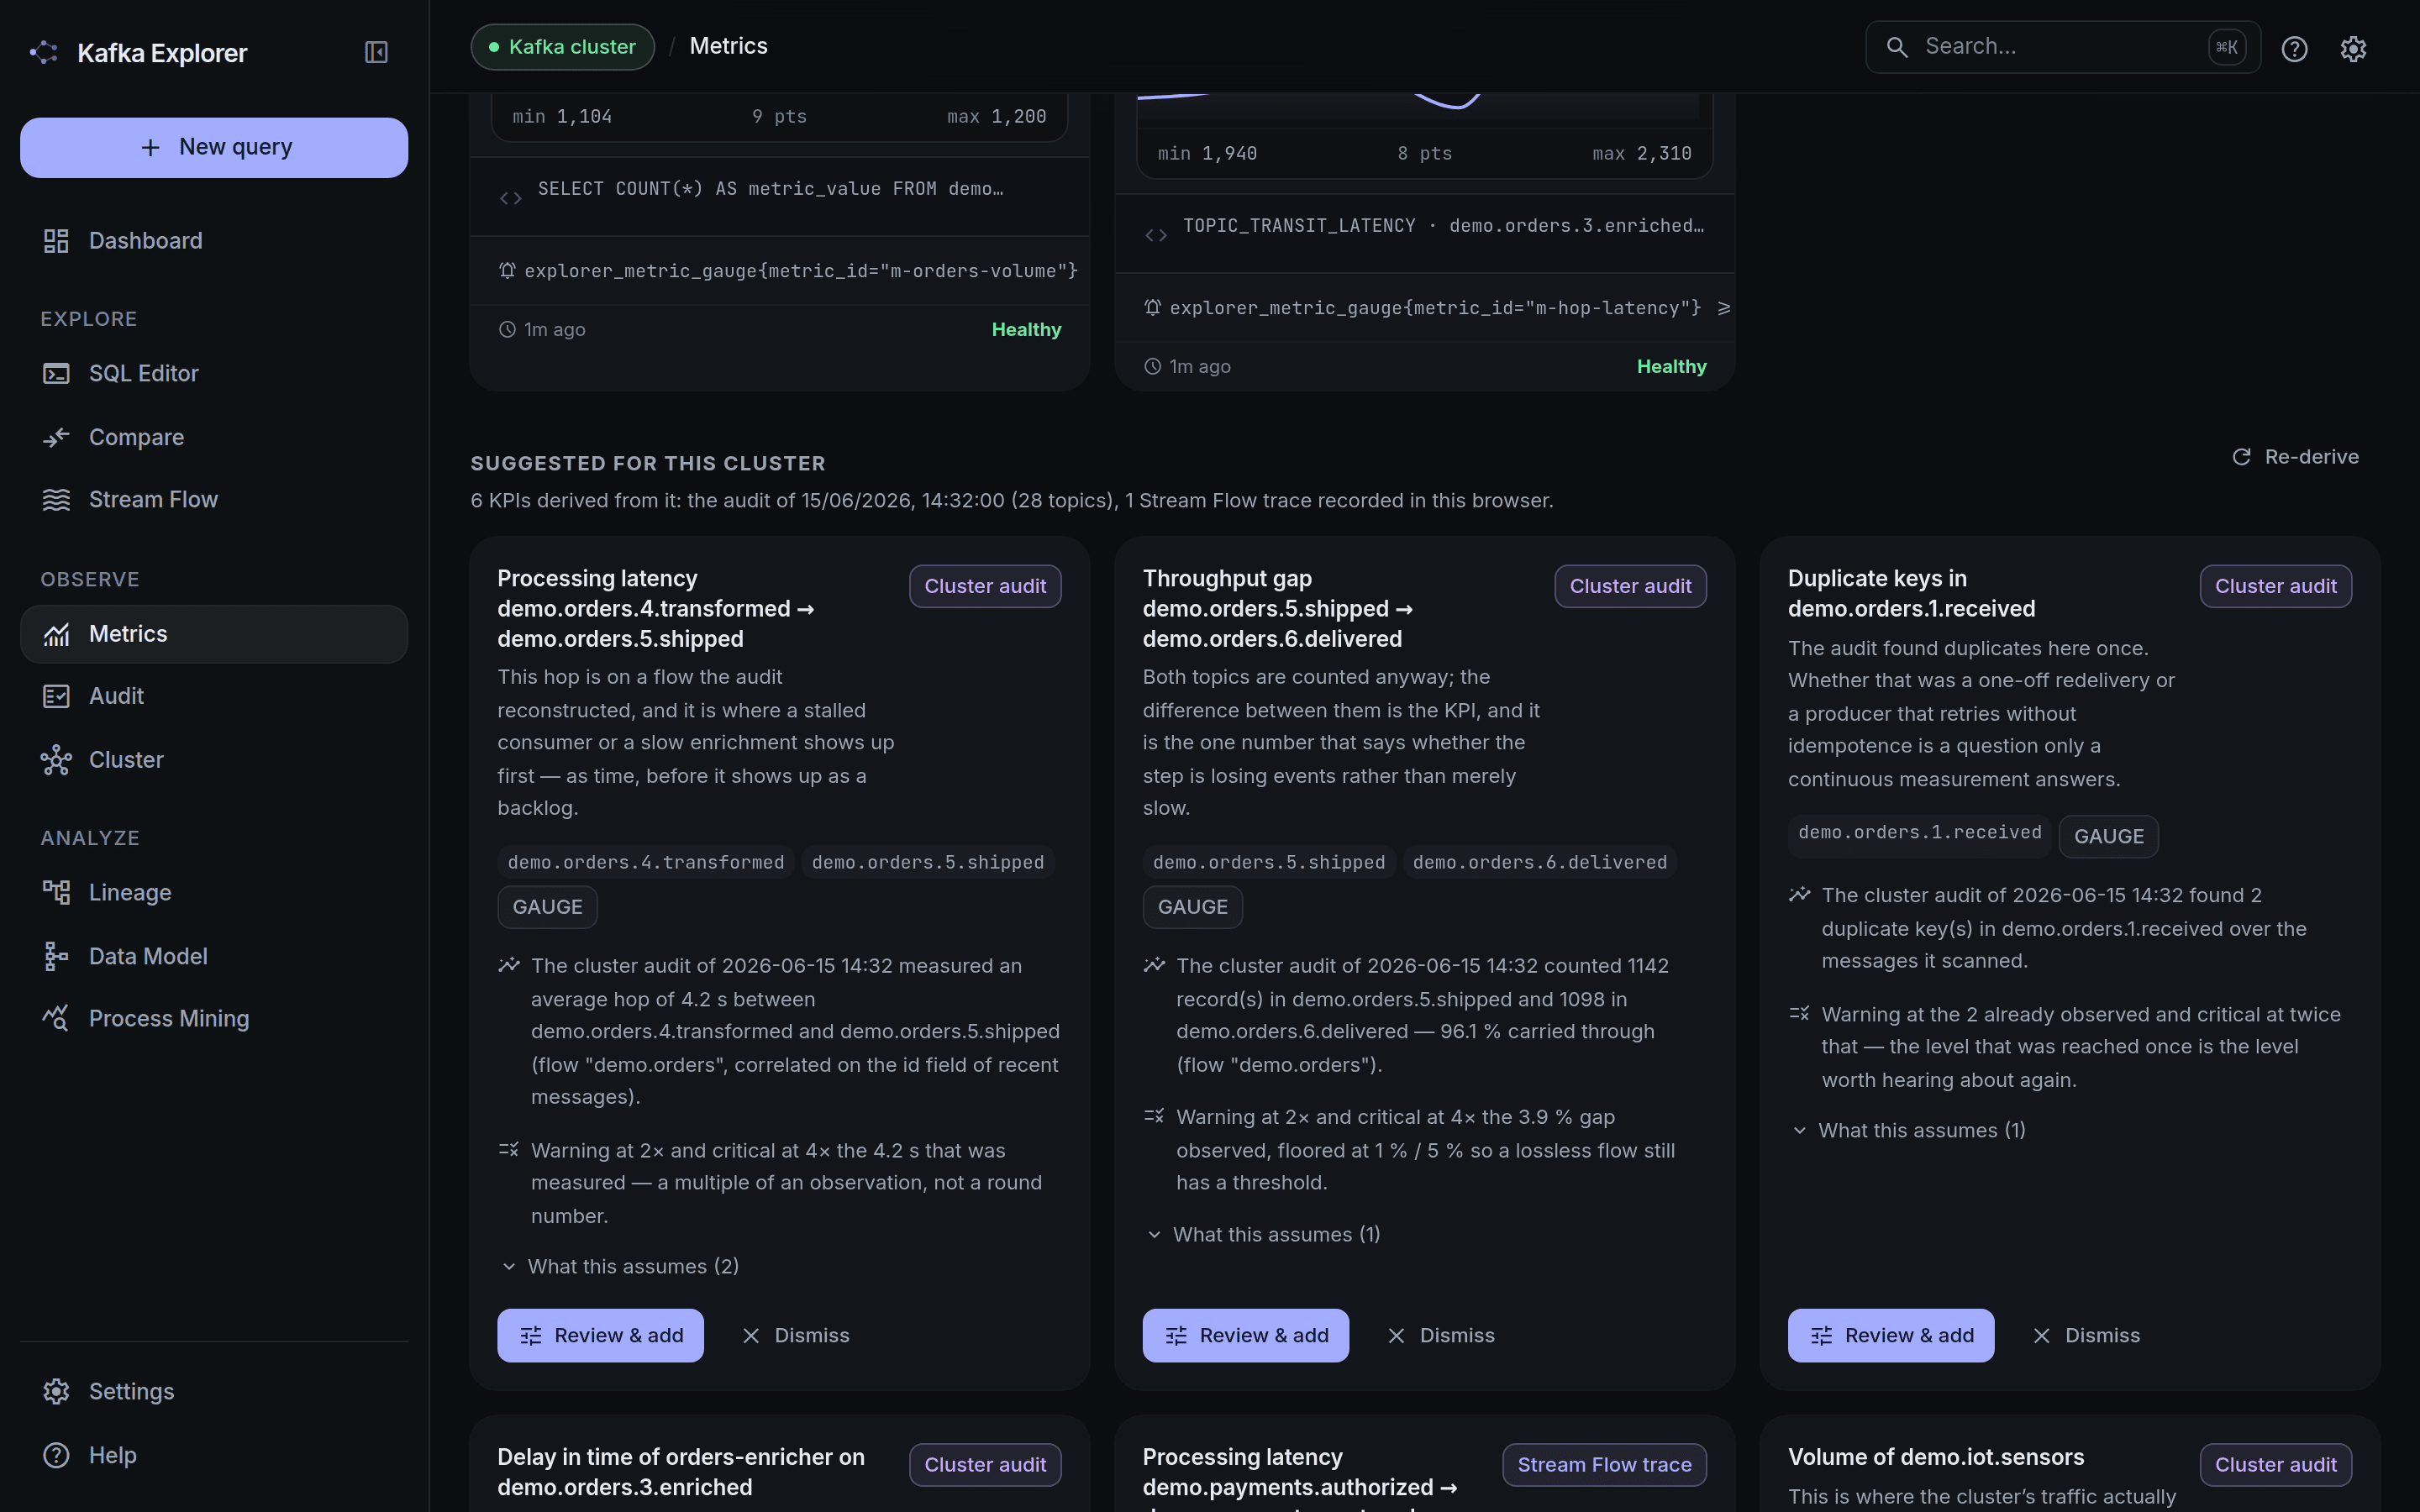
Metrics — turn a query into a Prometheus series, and let the page propose the KPIs your own cluster calls for. Each proposal carries the audit measurement behind it and states that its thresholds are a multiple of that measurement, not a round number someone liked.
Also there and not pictured here: Cluster (screenshot) with the KRaft controller quorum and client groups, Lineage, Compare and Process Mining.
🏷️ Tags
| Tag | What it is |
|---|---|
latest | The newest stable release. Pre-releases (v1.3.0-rc1…) never move it. |
1.2.3 | An exact version. Nothing here ever re-pushes one. |
1.2 | The latest patch of that minor line — it moves. |
Architectures: linux/amd64 and linux/arm64 (Apple Silicon, Graviton — natively,
not under emulation). CI builds and boots both before a version is cut.
In production, pin the digest, not the tag. "We never re-push 1.2.3" is a promise;
@sha256:… is a property. Every release
publishes its digest with the pull command:
docker pull compagnonsdudev/kafkaexplorer@sha256:<digest-from-the-release-notes>
The same image, same digest, is also published on GHCR:
docker pull ghcr.io/devdownin/kafkaexplorer:latest
Images carry a full SLSA provenance attestation and an SBOM
(docker buildx imagetools inspect --format '{{json .Provenance}}' …). If Docker Hub's
tag listing shows a third, unknown/unknown platform next to the two above, that is those
attestations — an extra manifest in the index, not a broken build.
🔎 Operational MCP reviews
The MCP server is enabled on this image but requires EXPLORER_MCP_AUTH_TOKEN to
serve calls. It is read-only by default. Three reviews help an agent distinguish
measured facts from configured expectations:
| Tool | What it checks |
|---|---|
kex_consumer_lag_trend(topic, groupId) | Compares two complete lag/offset readings and reports producer and consumer rates. The first reading has no trend. |
kex_topic_policy_review(topic, environment) | Compares observed replication, in-sync replicas, retention and cleanup policy with your rule for that environment. Missing rules return NOT_CONFIGURED. |
kex_dlq_review(queueTopic) | Checks DLQ/source/retry metadata and a bounded header sample. Connector, monitoring and replay references are declarations; no replay happens. |
For scheduled checks or multiple Explorer instances, set
EXPLORER_MCP_LAG_HISTORY_DIRECTORY=/shared/lag and mount the same writable directory
on every instance. The backing filesystem must support interprocess file locks. The
shared baseline lasts 48 hours by default (EXPLORER_MCP_LAG_HISTORY_TTL_MS=172800000);
without the mount the baseline lasts 30 minutes in one process and is lost on restart.
Configure expectations on Explorer, for example:
explorer:
  mcp:
    topic-policies:
      - environment: prod
        min-replicas: 3
        min-in-sync-replicas: 2
        min-retention-ms: 86400000
        max-retention-ms: 604800000
        cleanup-policy: delete
    dlq-routes:
      - queue-topic: orders.dlq
        source-topic: orders
        retry-topics: [orders.retry]
        connector-name: orders-sink
        monitoring-reference: dashboards/orders-dlq
        replay-runbook: runbooks/orders-dlq.md
These are examples, not suggested universal thresholds. Forecast thresholds are likewise operator-owned and include direction, horizon, confidence, history quality and series/version provenance. Scope agent access to the appropriate topic and group prefixes. The complete deployment reference explains the properties and limitations.
⚙️ Essential settings
| Variable | Default | Meaning |
|---|---|---|
KAFKA_BOOTSTRAP_SERVERS | localhost:9092 | Broker address reachable from inside the container (not your host's localhost). |
KAFKA_CONSUMER_GROUP_PROTOCOL | consumer | For Kafka 4.x; use classic on older brokers. |
KAFKA_MODE | PLAIN | Also supports SSL and CONFLUENT_CLOUD. |
EXPLORER_MCP_AUTH_TOKEN | — | Bearer required by /mcp; without it MCP returns 503. |
EXPLORER_MCP_REQUIRE_TLS | true | Configure HTTPS or TLS termination for remote access. |
EXPLORER_MCP_READONLY | true | Mutating tools are then absent from the registry. |
EXPLORER_MCP_ALLOWED_TOPIC_PREFIXES | * | Limit the topics accessible to agent tools, including SQL. |
CLAUDE_PROVIDER | OPENROUTER | Use OLLAMA or SPECTRA for a local model. |
Mount /app/data to keep UI settings and /app/logs to keep logs. Give the
container a memory limit of about 2 GB. All settings and troubleshooting steps:
deployment reference.
🔒 Before you expose it
The web UI and REST API ship without authentication; publish port 8080 on loopback or place an authenticating reverse proxy in front of it. The MCP bearer protects the agent endpoint, not the web UI. Pin a release digest in production and see SECURITY.md for vulnerability reports.
📚 More
Tag summary
Content type
Image
Digest
sha256:1c56093fb…
Size
337.6 MB
Last updated
5 days ago
docker pull compagnonsdudev/kafkaexplorer